Steemit Crypto Academy Season 6 Week 4 Homework Post For Prof @abdu.navi03 : CRYPTO TRADING STRATEGY WITH MEDIAN INDICATOR

My understanding with the median indicator.

The median indicator is one of the useful indicator we used in technical analysis which help us in determining the mid point range of each period this indicator uses what we know as the average true range (ATR) in determining the high and low of a particular price chart which makes it somewhat different from other indicators used in determining the trend of the market.
The median indicator is somehow similar to a moving average as it moves in the same manner as an EMA only it does so with a thick median line, this median consists of two colours which depending on which it gives off could either be indicating an uptrend or downward trend this colours are purple and green when the current price is above the median line then that is a strong indication to buy and if it's below the median line is a good signal to sell like we already know the median indicator is like the moving average with the green colour signifying uptrend nd the purple denoting bearishnes
Parameters and Calculations of Median indicator. (Screenshot required)
We know how this is calculated is the median of length chart gotten by dividing the sum of the low and high price, the median indicator is actually enveloped by bands based on the average true range (ATR) now for this bands to be calculated an ATR value for a particular ATR length is being multiplied by the ATR and then added to or subtracted from the median as the cases maybe what am saying in simple maths is this;
Upper band = Median length +(2ATR)
Lower band = Median length -(2ATR)
Now while setting it parameters we have some terms as;
Median source: This is usually hl2 by default which is just the source as to how the median is being calculated
Median Length: This is just for knowing how many of data points exactly was used while carrying out calculation to determine the median and it's usually 3 by default
ATR Length: This is usually 14 by default and basically just the time period
ATR Multiplier: shows the number that the ATR must be multiplied by to form the band usually 2 by default

Now we can also choose the different style we want like how we would want the indicator to appear on the chart like colour-wise here though it's all on default as we can see the upper band is green the lower band is purple, median EMA is blue and median is somewhat red ofcourse each trader could choose to change this colours to any that suite him best as the colour is completely irrelevant to the accuracy of the indicator.

Now after this setup the pic below shows how it appears on a chart the median indicator live on the ETHUSD 4 hourly timeframe

Uptrend from Median indicator (screenshot required)
The median indicator as we know is used for dictating the trend of the market very similar to a simple moving average but it does uses colour to often indicate trend when the median is higher the green cloud appears which indicates an uptrend in the market and a good buying opportunity, whenever the median line do cut above the EMA it alerts traders to enter a buy position since thats a signal of some upside in the market.

From the image above we saw that the median was higher and the image was showing green which do confirm that we are to see some upside hence i was promted to enter my position with stoploss slightly below incase of reversal.
Downtrend from Median Indicator (screenshot required)
Just like for the uptrend the way we determine the downtrend is also pretty easy if the median cuts below the EMA then a purple colour appears depending on how we set it signalling a downside it downtrend now as we know the median indicator helps us to know the market trend now in this case it gives us a good opportunity to take advantage of this by selling short yes traders or investors could use this as good opportunity to sell as the price is in a downtrend as such more downside is expected.

From the image we can clearly see the median line cutting below the indicator which purple line appeared signalling a trend in the downward direction so i put a sell order stoploss slightly above.
Identify fake Signals with Median indicator(screenshot required)
No matter the indicator we are using or the pattern we are trading there is always risk of fakeout and that risk is also common in their median indicator a useful indicator no doubt but has some potential risk of fake outs as well that is why whenever we are using an indicator it's often useful to use it alongside another indicator to help filter out unnecessary noise present in the market and reduce risk of falling for fakeout in trading
The median indicator indicator could be used together with an RSI indicator this indicator helps us know when a market is overpriced or not for instance when is at 70 and above it's a sell signal as the market is clearly over bought then from 30 and below a good buy signal as the market is oversold and bounce off is likely underway, so by using the RSI indicator along with the median indicator it will help reduce the potential risk of fakeout

Ass we clearly see from the chart the RSI is well overbought at 100 which normally we should be expecting or seeing a downside but then looking at the median indicator is not really reversing just yet instead it's rather indication to buy in this case we should keep calm and only enter a trade when the median indicator and the rsi is in confluence like in this case👇

The RSI indicator is showing over bought which means downside is expected and it's being reflected by the median indicator which has broken below the EMA and in the purple area denoting sell as well.
Opening two demo trades, long and short, with the help of a median indicator or combination that includes a median indicator (screenshot required)
For A Sell Order

I carried out an analysis on the DOGEUSD pair on the 1 hour timeframe using the median indicator as my tool from my analysis on the hourly chart of doge initially there was green cloud allover but then it appears that the purple cloud begin to form as the median line began to drop below the EMA which is a clear bearish signal based on the functions of this Indicator so i placed a sell or short order on the market but executed this on my mt5 demo account as the pic below shows.
 MT5 screenshot
Well the pic shows proof of my order being placed on mt5 stoploss at $0.11149 takeprofit was at $0.11107 i entered the position at the current price after carrying out my analysis.
Buy Order
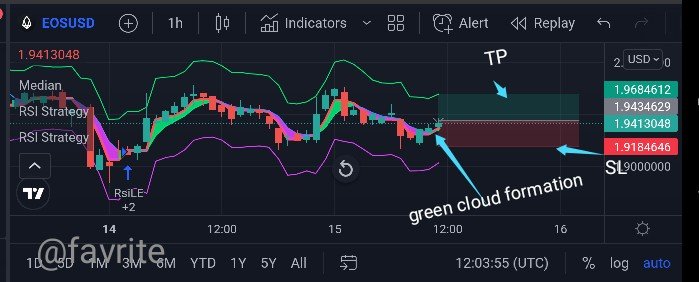
This is the chart of Eos on the hourly timeframe using my median indicator i saw the transformation from a purple to formation of green cloud after the median life crossed over the EMA signalling underlying strength and a bullish reversal so i placed a trade a long order on mt5 demo account with stoploss slightly below and take profit above my entry.
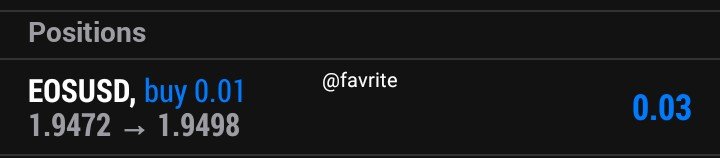 Mt5 screenshot
Proof of order placed and executed on mt5 mobile app
Conclusion
The median indicator is a very important and useful indicator while carrying out technical analysis as it help us determine the trend and flow of the market which help traders to act accordingly in other to stay profitable, true we should endeavour to always use it with other indicators like the RSI if we want to avoid occasional fakeout that is prevalent with any one indicator, really happy for the homework task for the week prof @abdu.navi03 as this has been really helpful.