Steemit Crypto Academy Season 6 Week 3 Homework Post For Prof@shemul21 : Crypto Trading by Identifying Support and Resistance


What is Support & Resistance zone?
.png)
When we talk about the support and resistance line are actually a line connecting points where the price of a financial derivatives usually gets rejected at or supported at depending on the trend that is, it is usually in the form of a horizontal line and when it's drawn above the current price is resistance and bellow the current price then it is actually support.
The resistance level is actually a point where the market has rallied to before and failed to breakthrough and the support is usually drawn connecting points below where the market previously bounced off of whilst falling those point where buyers stepped in is usually the support line, infact the support and resistance line is very crucial in trading the financial market we can't be trader without Identifying this points the support line signifies that there are more buyers than sellers at that price point hence the price refuses to push below further while the resistance line indicates most often an area where there is more sellers than buyers hence the price always retraces upon reaching this point
The resistance line indicates more supply than demand while the support line indicates more demand than supply hence the price is often expected to bounce off of support when the price breaks above resistance it turns support and if it breaks below support it turns resistance.

Explaining different types of Support & resistance with proper demonstration.
We basically have 3 major types of support and resistance and they are; horizontal support and resistance, sloppy support and resistance, dynamic support and resistance.
Horizontal Support & Resistance

Well the resistance line is often drawn by connecting the highs in the price chart, that is a horizontal line drawn on top of the current price usually a place where price has previously attempted to breakout from but often fail to do so, from the image above we can see the resistance line above and we can see that the price seems to be really respecting that resistance line this is on the chart on klayusd and it seems that when ever the price level approaches this horizontal resistance line it often gets rejected so most often the horizontal resistance line provides a perfect opportunity for traders to sell short and if the price manages to break above resistance line previous resistance now will act as support.
The resistance line is always above the current price while the support is below, and just like the resistance line the horizontal support line is drawn connecting different low points always around the same level no wonder a horizontal line could connect it though at times it may not be 100% perfect but the support line as we saw below is often where the price is expected to bounce off it is at this levels that the bulls step in to push the price back up and traders often mark out this levels as potential buy long opportunity as we saw in the chart below whenever the price approaches this horizontal support it bounces off and when it do break below previous support turns resistance.
 trading view
Such is the nature of horizontal support and resistance
Sloping Resistance & Support levels
This type of support and resistance level is usually being identifed in a trending market we can easily identify it either in an upward trend or downward trend depending on which the market is on at the moment, it is not drawn with horizontal line as they are not straight out as horizontal line but still it maintains a level which with the help of a trend line we can easily connect this to serve either as our support or resistance.

The image above depicts a downward trend where the market makes series of lower highs and lower lows now in this case it is not like a horizontal support line even though one low is lower than the previous one is still acts as support as long as the levels are respected the image is an example of a sloping support a trendline support and as long as the trendline support holds then there is still hope for the bulls we can also have this in an uptrend where a price makes higher lowers which connects together to serve as a support
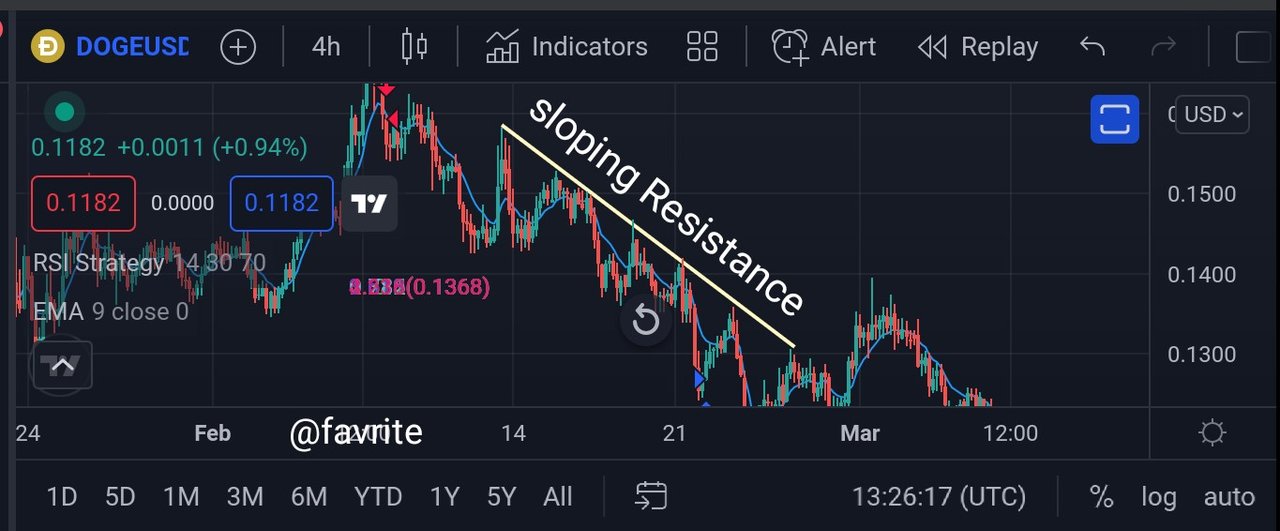
An example of a trendline resistance line drawn connecting series of lower highs with each attempt of the price level to push up it ends up making a lower high which when this point are connected perfectly using a trendline they serve as our text book resistance trend line, with each attempt of the market to push higher it's unable to reach the previous high this also indicate a downward trend but at times depending on the pattern being formed lowers highs could signal bullish reversal if it's a falling wedge for instance we can also draw this resistance line if it's making higher highs at which case it will be pointed or curved upwardly
Dynamic support & Resistance
This support and resistance is being identified using moving averages is not in the form of trendline support and resistance or horizontal support and resistance line.

The image above is the 4 Hourly chart of dogeusd and from the chart i actually did pull up two EMA, a 50 EMA and a 20 EMA and what's interesting to note in this is that when the price as shown gets to this ema it gets rejected or break down it seems on the 4 hourly chart that this moving average is now serving is a resistance point where the price gets rejected upon reaching at the time it may slightly shoot above one moving average but will still be in between the two

Now if we look at the chart above on the 1 hour timeframe this moving average did act as a support for the price point, now the support and resistance line of this dynamic system is not like others as it depends on the timeframe we are looking at and as such i believe for a better results a bigger timeframe should be considered, now in this case the price seems to bounce off upon reaching the 50 and 20 EMA which acts as a dynamic support in this case.
Identifying The False & Successful Breakouts. (demonstrate with screenshots)
Well to illustrate this i will be using the horizontal support and resistance to identify a case of successful breakout and failed one

The image above shows a klayusd price chart on the 4 hourly timeframe and from my observation it is very clear that the price attempted breaking down the support infact it did breakdown and another candle was open below the support but it's interesting to note that after the red candle that broke the support line the next candle that opened below support was a japanese hammer candle stick and this shows that true sellers enters the market driving the price beyond the support was lost steam and was unable to push the price any lower and the bulls step in to defend the level which resulted in false breakout and if one had entered a trade at break down point he would have been stopped out or liquidated.

The above image shows a successful break below support on the neousd chart on the 1 hourly timeframe, the price of neo did dipped below support and it was followed by a red candle which was unable to reclaim the level the sellers overpowered the buyers and succeeded in pushing the price further down hence breaking that support line that is an example of a break below support as the price fell until reaching a certain level where it found support again
Using Volume and RSI Indicator Combined with Breakouts & Identify the Entry Point. (demonstrate with screenshots).
Breakout usually occurs when a pattern is formed or a breakout from a horizontal support and resistance when the price breaks above resistance or below support we could look at that as a breakout in case of patterns after the price must have consolidated between support and resistance especially for a wedge or triangle pattern it usually breaks down or up depending on the market trend and one thing common with breakout is that it is usually accompanied by high volumes when a price breakouts occurs the volume usually spikes up infact when breakout occurs and there is no spike in volume we may be at risk of a false breakout if we entered a trade while the rsi is also a good tool in indicating if the market is oversold or overbought which shows what will likely happen soon 70 and above shows overbought retracement is likely to follow soon 30 and below shows oversold a bounce off is likely imminent.

From the chart we can see a wedge pattern though i wasn't able to get it all because of screen size this was on the 15mins timeframe of ARPUSD chart now it is interesting to note that before the breakout to the upside on the rsi it was showing oversold as it was around the 30 market which means the market was greatly undervalued and it bounced off that level and began moving up which coincided with the price breaking out of the pattern to the up side and if we observe closely we can see at the time of breakout there was a huge spike in volume a big green candle signalling that the breakout is legit giving us confidence of this breakout and if am to enter a trade then my good entry point will be at the point of break out that is the next green candle that opened on the resistance line after the candle that punches through the resistance to be on a safer side as the image above rightly depicts.
Taking a Real Trade(crypto pair) on Your Account After a Successful Breakout. (transaction screenshot required).

This is the chart of audio on the 1 hourly timeframe and i did draw a resistance line to identify points that have previously acted as a resistance for the price in subsequent times and with the price approaching this level i knew only one of two things could happen, a rejection or breakout so from the chart the price appears to be breaking out of this resistance so i entered a trade from the breakout point on binance.

As you can see the price really did breakout so i Identified a resistance line upfront likely the point where i will take profit at $0.8 and my stoploss was slightly below my entry that is below the initial resistance now serving as support it was a trade of $50 on binance futures
 binance screenshot
As you can see my trade was entered at $0.789 from the breakout point always love a sniper entry
 binance screenshot
The image above shows proof of my trade progress further indication of my breakout trade after a successful breakout or break above resistance
Explaining the Limitations of Support & Resistance (false breakout).
Well I believe that trading support and resistance only could be quite profitable but the truth still remains that the support and resistance trading strategy alone is a bit ancient as such one who trades using only support and resistance could be at risk at times of being stopped out or liquidated because when we trade only this break out from either support or resistance sometimes the price reverses back after breaking out of these price levels and most often times as people who are waiting for this breakout we have already entered into our positions only for the trades to reverse against us.
Some traders today who focuses only on support and resistance line may have risk of having their trades being stopped out in an event of a reversal that is why it is good to use other indicators not just only support and resistance because at times the price level may be breaking out of a major resistance or a major support and yet the volume instead of increasing it is decreasing in this case even though the price has broken out of this major levels there is a very high risk of it reversing back because any breakout not accompanied by volume there is a strong probability of it being a false breakout that is why traders are often warned or rather advised against breakout during the weekends with no volume.
So I clearly believe that's for the support and resistance trading strategy to be more effective it has to go hand-in-hand with other indicators like we should be aware of the volume whether the volume is decreasing or the volume is increasing it will be good to use the RSI indicator which will really show us the true value of the market whether it is oversold or overbought so that we will not be fooled into any potential breakout a moving average would not also be a bad idea as it help us to determine the general trend of the market so whilst trading support and resistance could be profitable there is always a risk of a false breakout which could be prevented with some of all these other indicators so this is one of the major limitation of support and resistance that I know
Conclusion
I believe support and resistance is one of the major keys in trading the financial market it is true it may not always be accurate that is if we base our trading only on support and resistance but then there is a vital truth no trader can do without first identifying the support areas of an asset as well as its resistance areas before thinking of applying other indicators we must first of all know where the support is and where the resistance is because these things are key to our trading life so I believe that whenever we are able to identify the support and resistance of an asset weather horizontally or sloppy or dynamic support and resistance then we are a step closer in being successful in trading yes it is vital that we understand that the support and resistance line does not only take one shape or form it can comes in varying forms as we know a different types of support and resistance as the case might be