Season 5 Week 1 Homework Post For prof @reminiscence: Understanding Trends
What I Understand By A Trending Market
Well trend in a literal sense refers to the general direction that something is moving or changing to. In the financial market or while trading a security, derivatives or stock as they case maybe we say a market is trending if it moves in one specified direction. In a trending market it's possible to have a slight retracement mostly in the shorter time frame but generally especially in the bigger time frame that path of the market is generally moving toward one direction.
Well it's always wise to follow the trend while trading as we wouldn't want to trade against a particular established trend which could be detrimental to our portfolio. We move with the trend as it is used to show the general trajectory of a an asset and helps traders in making analysis on their trade which will help them be profitable if they follow the trend.
The trend is often said to be our friend in that if we follow it we have a higher degree of certainty of being profitable. A trend can usually be in an uptrend or in a downtrend.
When the trade is in an uptrend that is when it is making higher highs and higher lows in this kind of trend traders capitalize by longing the market that is buying or if the trend is in a downtrend which means it is making a lower high and lower low traders too capitalize on this trend by selling or shorting the market.
By following the market trend traders often maximise their profit. In some cases too the market could be in moving sideways which is to say it is majorly bouncing between resistance and support without any specified direction whether upward or downward.
What Is A Bullish And A Bearish Trend
In the market or if we do trade derivatives or assets then by now we would have certainly being familiarize about some basic terms as bullish and bearish, this are terms closely associated with the derivatives market and basically is to know how the market is faring generally depending on the trend.
Bullish Trend
A bullish trend is often indicated when there is a high demand of an asset at a particular time which usually causes prices of this said asset or derivatives to surge.
When a market it's in an upward trend we could also say it is a bullish trend and it's indicated by having a closing price above the opening price and having higher highs and higher lows in a given time frame as the case maybe. The price generally moves or surges up in a parabolic scenario breaking resistance levels as it does move up, when this happens we would know for a certain that we are in a bullish trend.
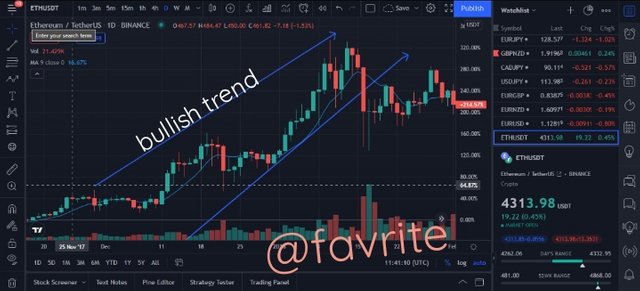
ETH/USD bullish trend on trading view
Bearish Trend
Well a bearish trend is more or like the opposite of a bullish one, it often indicate fear in the market as a result of sell off by investors which creates a bearish trend in which an asset moves in a downtrend for a given period of time.
When the opening price is higher than the closing price and their is formation of lower highs and lower lows we could say that the market is in a downtrend or rather in a bearish trend as the case may be.
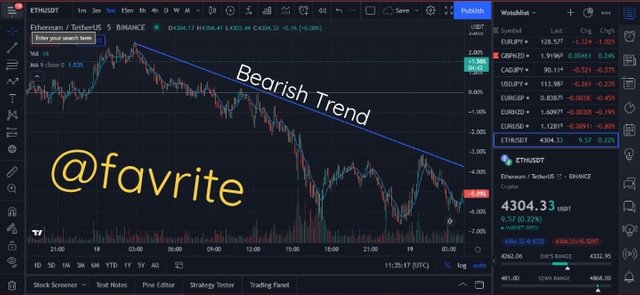
Bearish trend of ETH/USD on trading view
Explain the following trend identification and give an example of each of them. (Original screenshot needed from your chart). Do this for a bullish and a bearish trend.
When we talk about the structure of the market we are referring basically to the trajectory that the market is in and it's phase that is to say when we talk about market structure we may be talking about the current phase of the market if it's in a bullish or bearish phase.
Now when referring to a bullish market structure we know a bullish phase is followed with higher highs and higher lows and often the market closes above the opening price. This period traders take advantage and buy long on the market because of the bullish or upward trend.
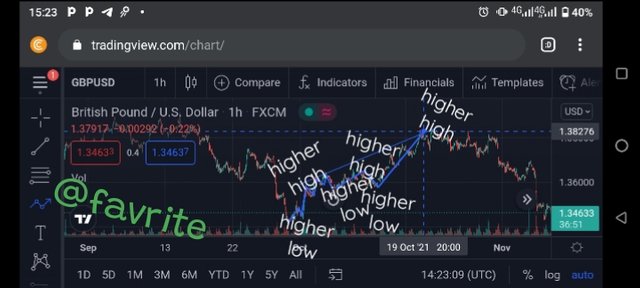 Bullish trend on GPB/USD on trading view
Now just like in a bullish trend a bearish trend is also denoting a market market but this time in a downward trajectory. It's followed by the market closing at a lower price below the opening price and has a formation of lower highs and lower lows. Traders who buy long on a downtrend will probably gets wrecked because the trend is against him. To capitalise on this trend most often it's to sell short as the market remains in a downtrend to look for opportunity to lock in a position and use the downward trend to our advantage, yes the trend is our friend after all
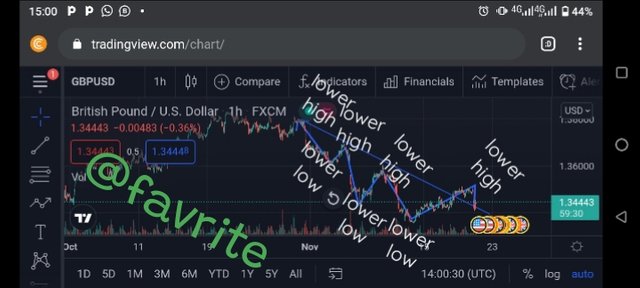 Bearish trend on GPB/USD on trading view
Now most times too the market structure doesn't necessarily need to denote a bullish or bearish trend or be in an uptrend or downtrend as the market do at times move sideways with no certain direction mostly bouncing off resistance and support level to keep the market in a range of certain price levels. No wonder we could easily refer to this undecided direction movement of the market to be a ranging market
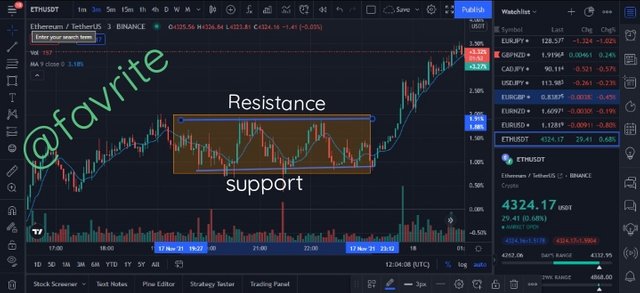
ETH/USD ranging market on trading view
Well in determining the trend or trajectory of the market trend lines has proven to be another useful tool which help us in carefully making such analysis. The use of this trend lines is in this manner or is dream mostly when two points are connected either in a bullish trend or bearish one.
The trend is your friend all the way until it is broken, which means that for a given trend let's say an uptrend the price at touching this trend lines usually bounces up and for a downtrend always gets rejected at touching it which gives traders a chance to make decent trade by following this trend lines but the trend is only valid as long as it gets bouncing up or rejected when touching the trendline once this trendline is confirmed to be broken then the trend whether bullish or bearish is no longer valid and as such no longer our friend but even an enemy as the case may be.
An example of a bullish trend line below
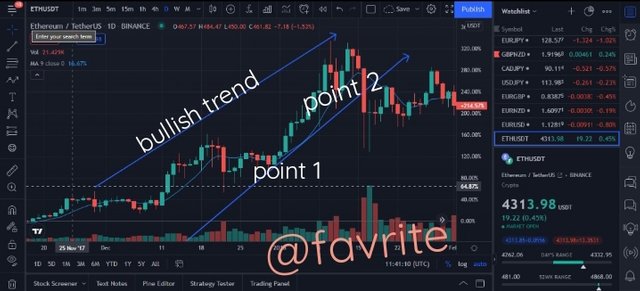
ETH/USD bullish trend on trading view
An example of bearish trend line below
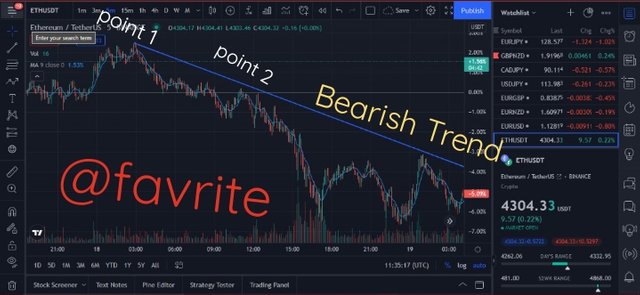
ETH/USD bearish trend on trading view
Explain trend continuation and how to spot them using market structure and trendlines. (Screenshot needed). And let this be done for bullish and bearish trends.
Generally a trending market is one which moves in one direction either upward or downward but the thing is this when a market is trending let's say in an uptrend this necessarily doesn't mean that the chart pattern will be a straight line chart without any retracement, no not at all infact for their to be a trend continuation reversal must happen upon which a trend line is tested before a continuation.
Always either in a downtrend or in an uptrend the resistance level or support line is often tested time and time again. In a bearish scenerio for instance when a price is going down at a point there will be a little accumulation to hold up the price and maybe push it up a bit and it will move up often in fake out and when it hits the trend line established point of resistance and it will continue in it's downtrend. Also for a bullish trend at a point traders take profit and their will be a reversal and the price moves down until it hits the trend line line of support and it will continue in it's upward trajectory.
No matter the trend a market is so far as the trend line acts as a resistance or support the trend will continue. So therefore a trend line continuation is the line of support or resistance in a trend line that a bullish or bearish price action must come down to and retest upon which the trend continues and if for any reason the trend line is broken then that particular trend is invalidated
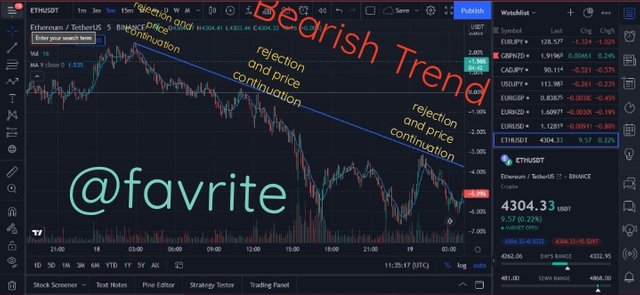
bearish trend continuation on ETH/USD using trendline from trading view
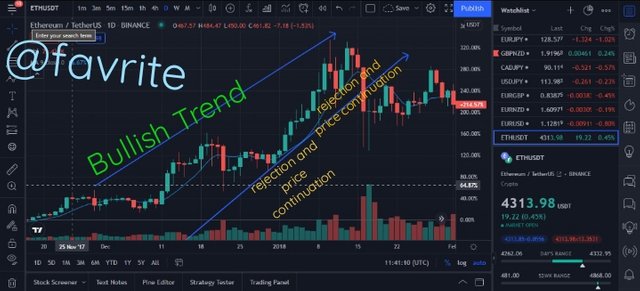
bullish trend continuation on ETH/USD using trendline on trading view
Now for market structure bullish and bearish continuation
For bullish case
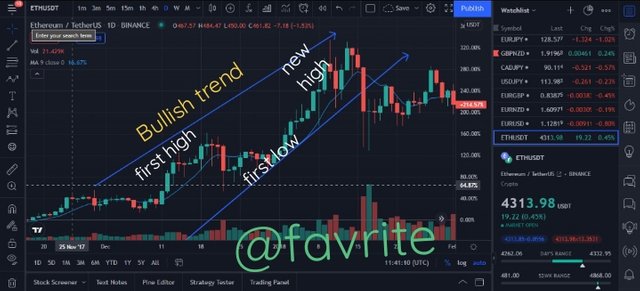 ETH/USD bullish trend continuation on trading view
In Bearish case
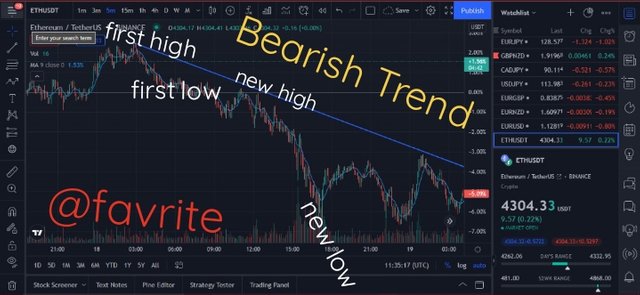 ETH/USD bearish trend continuation on trading view
Pick Up Any Crypto Market Chart And Indicate If The Market Is Trending And What Is The Current Market Trend
Well understanding what a trending market entails i have rightly choosen ethereum chart. And i rightly believe that the price is trending and overall if we look back around back to december 2020 when ethereum was trading around $660 and over the course of 11 months now the price is currently at $4300 as of when am making this post so i do believe that the ethereum market is in an uptrend.
Also on the daily time frame which i checked the ethereum price is also trending.
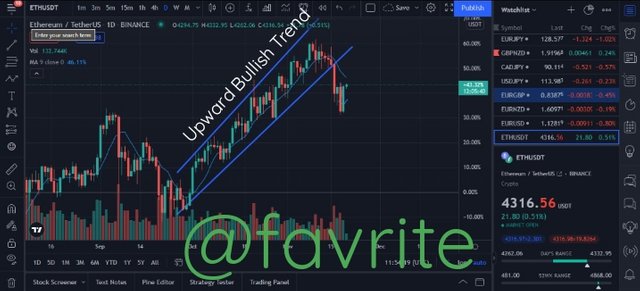 ETH/USD Bullish Trend on trading view
Just like the above image indicate on the current chart of eth/usd i carried out on the daily time frame it is very clear that indeed the eth market is a trending one and what is it's trend? Well it is on a bullish trend or upward trend whatever be the case.
CONCLUSION
In carrying out or for one to be a successful trader then i believe he or she must be able to analyze chart patterns of derivatives or asset in the financial market and discern the trend that the market is in so as not to be trading against the trend which often result in getting wrecked.
Analysis of chart patterns is crucial in opening position and one who can successfully do this is one step to becoming a successful trader.
Hello @favrite, I’m glad you participated in the 1st week Season 5 of the Beginner’s class at the Steemit Crypto Academy. Your grades in this task are as follows:
Observations:
This is correct.
Recommendation / Feedback:
Thank you for submitting your homework task.
Thanks prof @reminiscence01 for your honest assement of my homework post
Hello prof @reminiscence01 my homework post is yet to be curated yet it is four days old now.
cc:
@sapwood
@steemcurator02