Crypto Academy Season 6 Week 3 For Prof @pelon53: Support and resistance breakouts.

.png)
Explaining in detail the advantages of locating support and resistance on a chart before trading.
Well the support and resistance term is what we are well familiar with in trading and is something traders can not do without and failure to identify this levels could well lead to mis-trading, the support line is more of an area where demands seems to be more higher than supply making it unlikely for price to break below this level while the resistance level is where sellers are more than buyers making it unlikely for price to go beyond this level as it is a point many take profit in the market in an uptrend which often result in a reversal.
Now one of the numerous benefits of Identifying support and resistance line is that without it we can't really trade that's the basic truth there can't really be much of technical analysis without first taking note to identify this key points it is when we are able to identify the support and resistance line that we can have a good trade entry, yes our our entry points is important we don't want to jump into a trade that has already played out and this could only be possible when we identify the support and resistance level and they not only help us to pick out good entry points but an exit point as well, one thing is to enter a trade another thing is to know when to leave the market to lock in profit and support and resistance levels help us do that.
We know also that the market could be trending or ranging in a trending phase that is whether in an uptrend or downtrend our support and resistance level help us to know how to play the market because in a downtrend traders should be looking for an opportunity to sell short and in an uptrend traders look for opportunities to buy long now if a trend is established as an uptrend and traders are looking to buy the best buying opportunity is at the support while when in a downtrend the best shorting opportunity is when the price is at resistance that's why the importance of support and resistance can't be over emphasized
It is vital for day to day trading and when a resistance is broken it turns support if a support is broken it turns resistance, these levels helps us know where our entry point should be, our exit point, our takeprofit area as well as where we should put our stop loss slightly below support or above resistance depending on if we are buying or selling this are all the seeming advantage of the support and resistance line.
Explaining in my own words the breakout of support and resistance, show screenshots for the breakout of a resistance, use another indicator as a filter

When we talk about breakout in trading it usually occurs when a price breaks out and closes above a resistance level or below a support level, into the case of a breakout below the support when the price breaks below the support and closes below it then we know that the price is likely to continue going down and the support line varies it could be horizontal support line or angular support line or it could even be a support in a moving average a place where the price seems to bounce off of or where there are more buyers than sellers now when the price or a candle goes below this support line and closes below it and also maybe for further confirmation the next candle also opens up below the support line then it's pretty clear we have a breakout below support.
For a breakout above resistance it is also the same thing only difference is that the breakout of this result in an uptrend not a downward trend, when the price breaks above support and closes the candle above it then we have a breakout above resistance, today we also need to note that a resistance line could be horizontal, angular or dynamic as the case maybe. So when a price level breaks above this level of resistance which ever form it takes and closes above it and another candle also opens above this resistance we are pretty certain that a breakout has occurred because normally the resistance level is a point where the price has been unable to push through because at that level there is more sellers than buyers so for a price to breakout above resistance it shows the bulls are solidly in control and the market is in an uptrend.
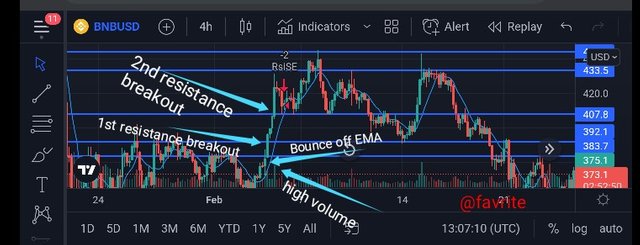
The image above depicts a breakout of a resistance level, the price level broke out of the first resistance area followed by another breakout of another resistance from the beginning from the pic we saw that the price was supported after breaking of from a resistance of a strong EMA which then turns support which shows much demand at that level and then it proceeded to break above the first level and went on to break another resistance level and if we notice in the volume there was a huge spike of a green candle at the point of breakout to further validate this breakout towards the upside and this is no surprise as the price was above the moving average during this point signalling or confirming an uptrend, so this is what a resistance breakout sure looks like
Showing and explaining support breakout, using additional indicator as filter, show screenshots.
Well we know that support breakout is basically when the price breaks below a support level which could be horizontal, angular or dynamic support as the case maybe when this price point breaks below the support and close below it then we know that the support line has been breached or that breakout below support has taken place.
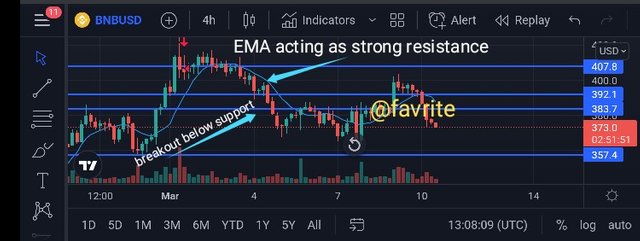
The image shows the chart of bnbusd on the 4 hourly chart and we could clearly see first of the price was falling from a major resistance level it has been rejected and it's interesting to note that the EMA was in confluence with the horizontal support pushing the price down to a support level and the support fail to hold and was broken in no distance so the price at the point of breakout below support was also below the moving average which suggest a downtrend and this is basically how a breakout below support looks like.
Explaining what a false breakout is and how to avoid trading at that time. Show screenshots.
Today many traders are at a risk of entering a false breakout, yes we basically watch a trendline and whenever we assume or see the first candle to break through it we enter a position which may be at a risk of being false so false breakout is basically when after identifying a certain level of resistance and support the price breaks above or below and just when we think it has broken out the price retraces back and goes back to the previous level before the breakout so when a price breaks out and retraces back again then that's a false breakout now we can basically avoid this false breakout in some ways.
Well to avoid false breakout we should be careful not to quickly jump into a trade at the first sight of a candle breaking through the resistance or support it is advisable to always wait for the candle to close above resistance or below resistance before entering a trade because jumping into a trade the first sight of a candle breakthrough may have a higher risk of false breakout infact in some cases we should for a candle to close above it first and also for a new candle to open above support or below the resistance line to further confirm the breakout
Another thing that can also help us avoid false breakout is not entering a power move that is entering a move after series of green large candles otherwise known as parabolic moves when we see this kind of moves without any pullback or retraces we should think twice about entering a trade because the market may just reverse against its advisable also to wait for a pullback in any breakout to confirm that the move will continue or even a retest of the trendline
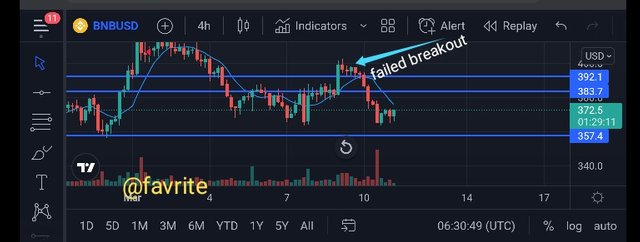
From the image above we can see that the price did attempt a breakout from the resistance line breaking through the trend line and the moving average only to retrace back that is a very good example of a false breakout we should be very careful of this kind of moves and should take all the necessary measures to make sure we do not trade in a false breakout so that we will not end up in loss
On a demo account, executing a trade when there is a resistance breakout, do your analysis. Screenshots are required
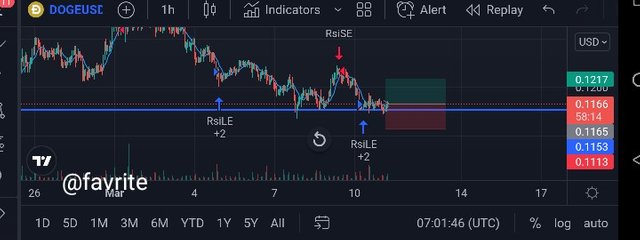
the above image shows the analysis are carried out on doge on the 1 hour timeframe and my resistance line clearly drawn from my analysis the price of doge did break through the resistance line and close above it and the new condo was also form above the resistance line which confirms a resistance break out and if we also observe the moving average acting as a resistance to the price of dogecoin on the one hour time frame was also broken so this clearly shows a resistance break out so I put in my trade at that very point on mt5 demo account
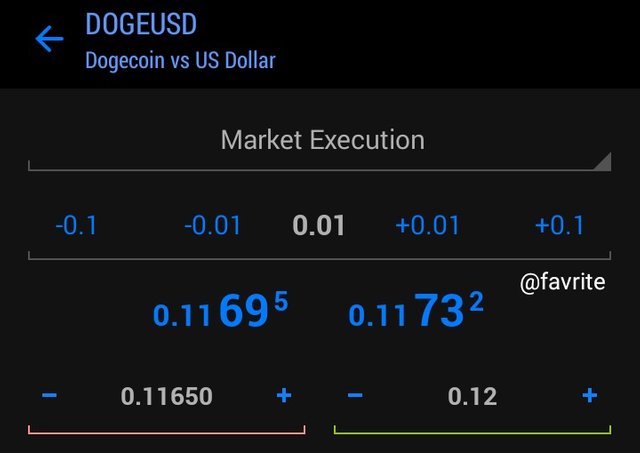 screenshot from mt5
I executed a buy order at $0.1169 outing my stoploss below the now support line at $0.11650 and my potential takeprofit at $0.12
 screenshot from mt5
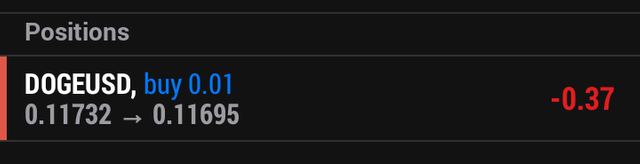
Proof of position on my demo account
In a demo account, executing a trade when there is a support break, do your analysis. Screenshots are required.
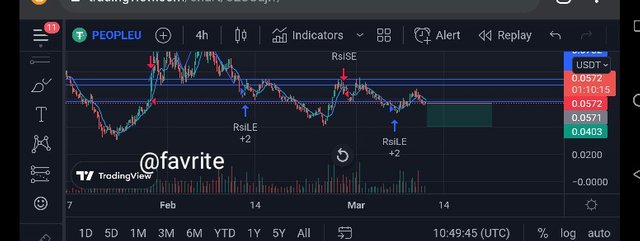
This is an analysis carried out on the 4 hourly time frame of peopleusdt pair and from the chart we can clearly see the price of people breaking below major support yes in what is a breakout below support broke below the moving average and the trend line support so I put in my trade order on tradingview demo account at the point of break out as the case may be.
Proof of my trade setup below
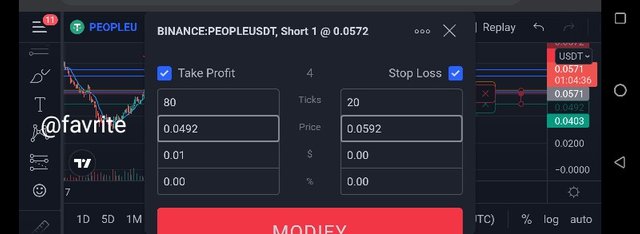 trading view
Conclusion
The support and resistance area is a very important level to identify while trading in fact it ensures that we are able to have a good entry and a perfect exit point that is why traders should take care before entering any trade to identify areas of support and resistance because this helps in trading of financial derivative in fact the importance of these levels that is the support and resistance area in the trading of any financial assets cannot be over-emphasized.