Crypto Academy Season 6 Week 2 Homework Post For Prof @shemul21: Crypto Trading With Moving Average


Explaining My Understanding of Moving Average.
Well the moving average is renowned for being of the flexible and most-commonly used technical analysis indicators it's very common among trades due to its simple nature and works best in a trending market, moving average could be a mean of a data and when it comes to technical analysis this set of data is represented by the closing price of stock for a given day.
Today traders could also make a moving average on a shorter time frame this is possible by using daily or minutes data, a trader for instance could make a 10 days moving average this could be done by adding up the data of an asset closing price in the last 10 days then divide this said data by 10 then we will have what will call a simple moving average now if we want to repeat or still compute a 10 days moving average for the next day this we mean we have to replace the previous price in the last computation with that of recent data to get accurate information and this sequence right here i mean the data shift each trading day to get this is simply what gave rise to the terms as we know it moving average
Moving average is a trend following indicator, it is used to determine the start of trend and to follow it's progress and to also help us determine trend reversals incase one occurrence of one, the moving average is more concerned with historical data and we should understand that the moving average is not like our traditional charting pattern which could help us in anticipating a trend, moving average is not like that but instead they only help us in confirmation of an already established trend, if a moving average contains a few days data this will enable it detects trend reversals a little bit faster, indeed the moving average is a powerful tool used in technical analysis which helps us to determine average price in a particular period.
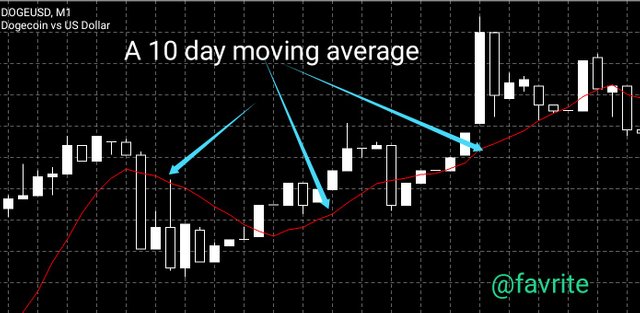 screenshot from mt5 mobile app
The Different Types of Moving Average? Differentiate Between Them.
The moving average is of different types we have the simple moving average(SMA), exponential moving average(EMA) and the weighted moving average all this are examples of moving average now to understand the difference between this 3 types of moving average we have to first understand what each of them mean so we will discuss this 3 to spot out its differences.
(a) Simple Moving Average
Simple moving average is of the oldest and is widely being used in carrying out technical analysis, it's a common tool for investors and traders alike because of its simple nature and it signals are easily understood, it's being used in the calculation of prices over a given period of time, the simple moving average is used in determining the mean average of price of an asset in a given period of time, the simple moving averages are usually being calculated by adding the prices over a given number of periods for instance a 15 day SMA would add the together the closing price for the last 15 days and then divide that number by 15 to get the average price.
1+2+3+4+5+6+7+8+9+10+11+12+13+14+15 =
120÷15
To give an average price of 8.
This is more or like a reactionary indicator and don't really predict future price movement and the signals this indicator produces it's more sensitive if it's data being calculated it's shorter.
(b) Exponential Moving Average
The exponential moving average is also a widely used technical indicator moving average when it comes to the usage of moving average in an asset chart, and the exponential moving average or simply the EMA gives more weight to recent prices and are calculated by applying a percentage of today's price to yesterday's moving average, the SMA's for instance simply look at all data's equally while the the EMA's try to factor in recent market moves higher in weight and unlike the SMA the EMA are able to pick up short term violatility alot quicker than the simple moving average though at the end of the day they are still a lagging indicator.
The EMA can be calculated by = Price Today × (something/1+days) + EMA yesterday(1-(something/1+days))
(c) The Weighted Moving Average
Unlike other moving average per say the weighted moving averages or simply for short WMA is a moving average that gives into consideration or pays attention more to the recent prices than the previous or past data yes unlike in the simple moving average which often makes use of past data and has a more distributed weightings the WMA gives more weightier consideration to recent data in its computations after which it usually sums up to 100% or 1 as the case maybe
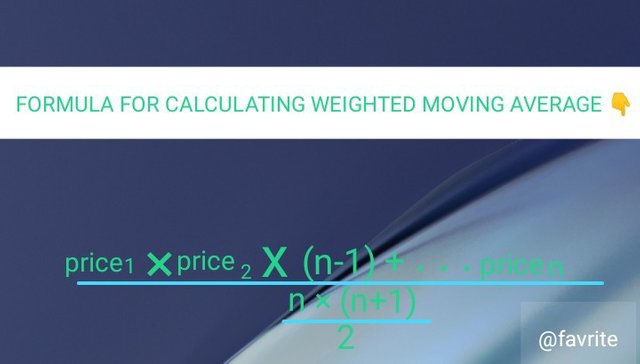 created by me using imarkup app
Now this three moving average has notable differences which we might have already cited from there various definition
| SMA | EMA | WMA |
|---|---|---|
| It's simply the arithmetic mean of closing prices | it uses exponential weighting factor to give more weight to recent price data | attributes most weight to recent price data |
| In SMA equal priority is given to all previous candles in calculations | It's more sensitive to recent price change | Gives more weight to recent price data |
| it's better used with higher time frames with 1day or 1week with 100 or 200 periods | being more sensitive to price changes it's more suited to lower time frames | it's most suitable for intra day trading with lower time frames of 5 or 15 mins and lower periods like 20 or 50 for intra day trading |
| The SMA is better used for dictating longer term trends and cancelling noise in the market | It's suitable for detecting trend reversals | When we deal on computation of recent data it is most suitable |
Identifying Entry and Exit Points Using Moving Average. (Demonstrate with Screenshots)
As we all know the moving average is a very commonly used technical indicator in trading and very common the price chart movement is always filled with ups and down in a fast moving market for instance we may see prices surging toward the upside to fall a few moments later and maybe begin another uptrend so the moving average is a useful tool in filtering the noise from this random price movements and smooth it out to enable us see the average value
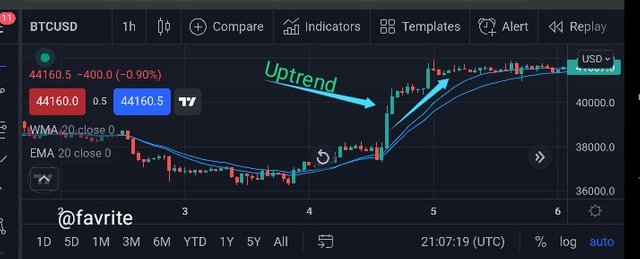
Today traders often consider the moving average line as a support and resistance line and they trade on it if they see the price going toward the moving average line they observe closely if it we bounce back or break through it just like as our usual support and resistance level most often than not when we are in an uptrend the price finds support at the moving average line and in a downtrend they gets rejected upon reaching a resistance line.
Since the moving average line can acts as a support and resistance line this means it can provide a tradable signal for instance whenever a price breaks or pushes above a moving average line traders takes this as a good indication to buy which shows the price is likely to continue going higher.
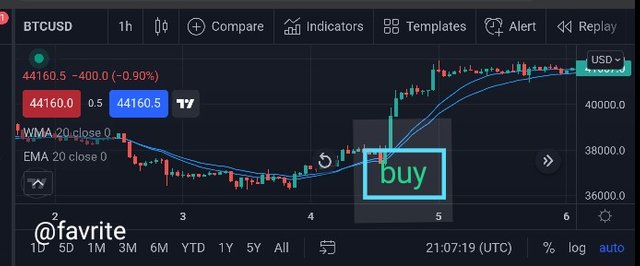 image source
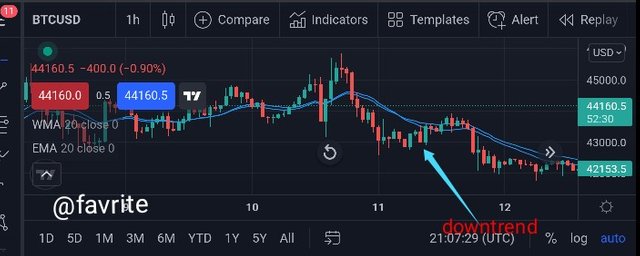
At the same time it can also serve as a good indicator to exit or sell that is when a price in an uptrend starts going down and upon reaching a moving average line fails to hold support and breaks below it then that is a good indicator to sell or exit the market
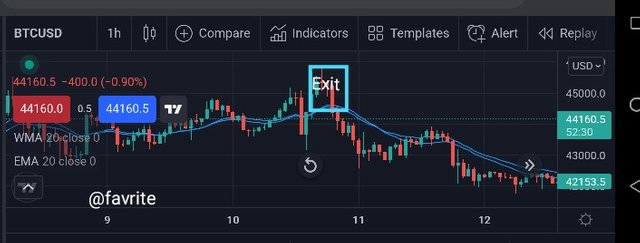 image source
As we can see the moving average can act as a good indication to know when to buy or exit a market we can also use the moving average to determine if the asset is in a downtrend or uptrend. For instance if the price is above the moving average line we consider it to be in an uptrend.
And if the price is below the moving average line we consider it to be in a downtrend
This all goes to show what a wonderful indicator the moving average is
What I understand by Crossover? Explain in Your Own Words.
Well when we talk about crossover that is moving average cross over it usually consists of two moving average let's say one is a 9 period moving average and another one is a 21 period moving average usually an exponential moving average or it could also be a simple moving average so this crossovers usually occur when this 9 period moving average crosses through the 21 period moving average when this happens it is known as a crossover.
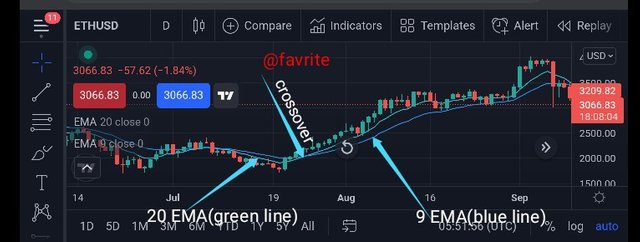
Yes this crossovers usually occur when one moving average was to cross over another it could be 20 EMA crossing through 50 EMA or a 50 EMA crossing through a 200 EMA, to me i believe it usually entails a moving average one that is smaller moving over a much bigger moving average let's take the pic above as a case study there we have the 9 EMA crossing through the 20 EMA and one thing that is usually consistent with this crossovers is that when they happen they actually server as a signal for something it could be something good or bad a move to the upside or downside but they do signify that something huge is coming.
To me when with this moving average when a smaller moving average in this case let's say a 9 EMA cuts below a 20 EMA thats a bad sign and could suggest momentary bearishness but when this Sam 9 EMA cuts above a 20 EMA and stays above it it's a good indication to buy so in all this crossovers helps traders determine a shift in market sentiment and serve as a good indication for determining upcoming market direction.
Explaining The Limitations of Moving Average.
Well just like any other indicators in technical analysis the moving average indicator do have it's limitations which are
Well when the prices of an asset is not trending that is when it is virtually moving sideways then it could be difficult to predict the next move using moving averages and even two moving average may frequently crossover each other in a sideway moving market
when we have a disorderly chart with lots of outliers application of moving average especially short term moving average may give off a false alarm that is a false buying and selling signal
If we are discipline investors who are always waiting for confirmation from the moving average we may miss out on profit as most times there is lagging in this moving average indicator and before it catches up to the current market price it would have already played out
Since the analysis is often based on past data this means that with each passing day in other to get a more accurate information it needs to be adjusted by continuously outing the previous day into consideration
Some moving average like the WMA which gives more weight to recent price for instance some investors are of the opinion that paying attention more to the recent price makes it harder to get the general overview of the trend as past data are crucial in this also
These are some of the notatable limitations of a moving average
Conclusion
Indeed i honestly believe that the moving average is a very useful indicator and should be used when making analysis though i am also of the opinion that due to some of its limitations like lagging it may not be wise for a trader to base all his trading decisions on the moving average so as not to be left behind. In trading there a wide array of indicators at our disposal which when careful put together could mean we would remain profitable in a long period and i believe the moving average is one among them and should be used discreetly by traders and investors alike.
Hello prof @shemul21 please my homework post is yet to be curated and is 5 days old already