Crypto Academy Season 5 Week 8 Homework Post For Prof @schin08:Reading Special Bar Combination

What Is Price Bars
Price bar is used to represent an asset trajectory as it relates to its supply and demand on a particular time frame. A bar chart is a series of verticals that results from segmenting the price action to clarify and a create a graphical shape it is used in joining the market highs and lows.
The bar chart or price bar is a technique for price charting that often consist of a vertical line that is used to represent the price range in a particular time frame and usually with the price bar the highest point in the bar represent the high price of a particular derivatives or asset while the lowest point is used to represent the low price of this said financial asset and the distance between the lowest point and the highest point or otherwise known as the low price and high price is known as the price range.
Well when we talk about this bars that is consisting of verticals line apart from the highest point and lowest point we also have we also have the opening price often represent in the form of a tick in the left side of the vertical line while the closing price is represented by a tick in the right side of the vertical line. Now this vertical line and the small horizontal line drawn at each end representing the opening and closing price is what we know as the price bar or simply the bar.
We also have what is known as the up day which is a bullish indicator that a price performed well for the day with formation of higher highs and higher low and we also have the down day which suggests a lower low and lower highs price action indicating a bearish day, we also have the inside day which forms lower high and higher low and outside day which forms higher high and higher low these are all discern by combining of two consecutive bars.
 source
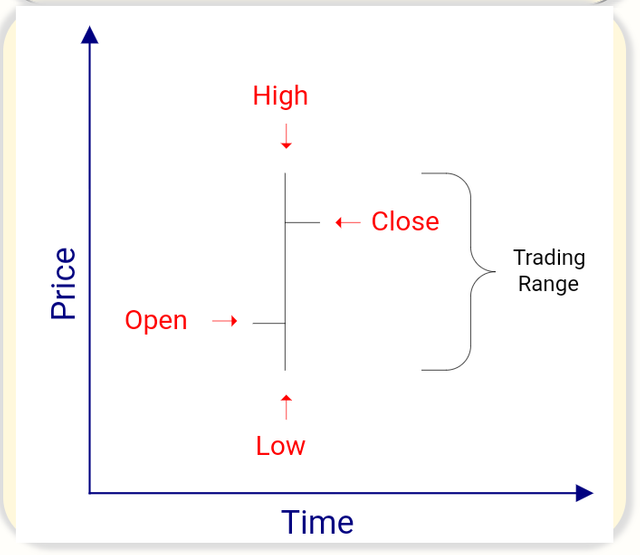
a graphical representation of a price bar
High: This is the highest point of the bar suggesting the highest price point in a particular time interval
Low: This is the lowest point of the bar suggesting the lowest price point in a particular time frame
Open:This is the small horizontal line drawn on the lower left of the vertical line suggesting the opening price of a particular derivatives in a given time interval
Close: This is the small horizontal line drawn from the upper right of the vertical line suggesting the closing price of a particular commodity in a particular time frame
How Do One Add This Price Bars On Chart With Proper Screenshot
Well to add this price bars on chart first of i log in to my trading view account and went on the on the chart area.
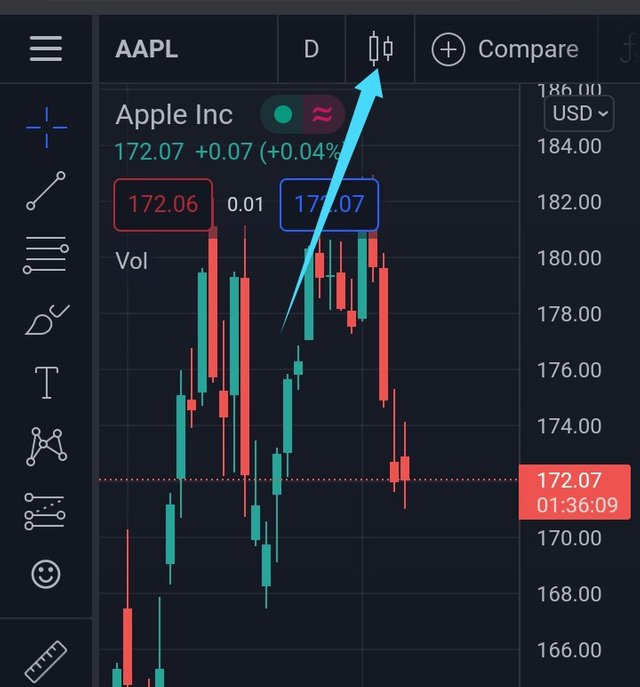
I simply click on that candles icon that the arrow was pointed at and then
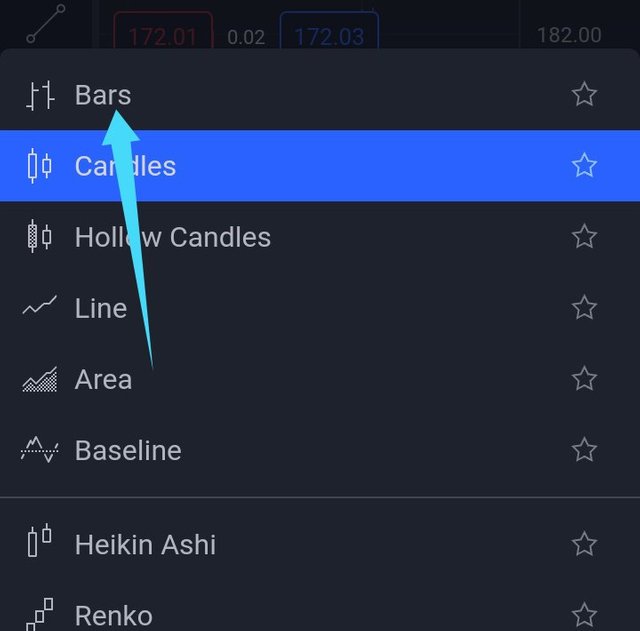
When i clicked there i was taken to this area where i saw bars, candles, hollow candles, area etc but then it was bars i was looking to add so i clicked on candles and then;
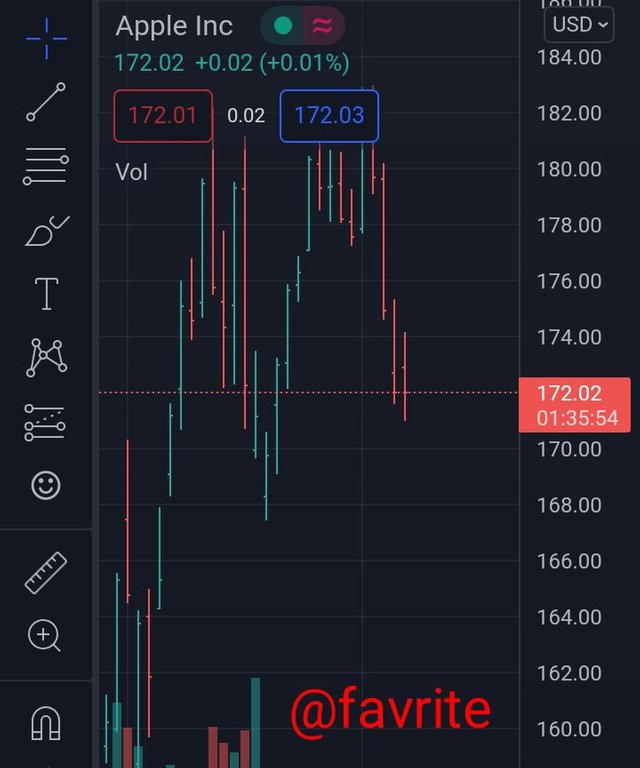
And my price bar was successfully added to the chart, easy peasy.
Identify Trends Using Price Bars For Both Trend.(Screenshot Required)
When it comes to trend identification we are generally talking about the two phase that a trend could generally be in, the market are usually either in an uptrend or a downtrend though in some cases also could be in ranging mood. The market forms some things often known as higher highs and lows etc and understanding this helps us to get an understanding of the trend that the market could be in whether in a downward trend or upward trend, now let's talk about some of this features.
Higher Highs:This is when the new high of an asset in a given time frame which could be hourly or daily is much higher or at least higher than the previous high recorded
Lower Higher: In this case the new high recorded is lower than the previous high which often suggest a bearish scenario
Higher Low: When the new low recorded in a particular time interval is higher than the previous low in that time frame
Lower low: This is when the new low printed is much lower than the previous low.
Now coming to this realization let's now talk about how to identify trends using price bars, let's talk about the uptrend first
Identification Of Uptrend Using Price Bars
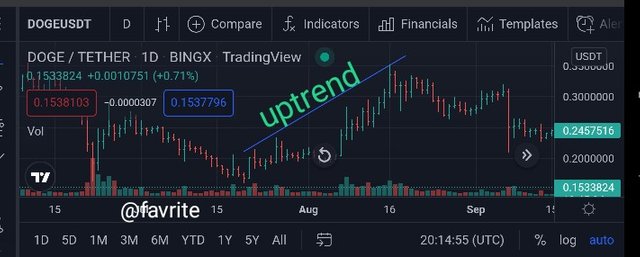
Ordinarily ofcourse an uptrend is accompanied or known when the price print a higher high and higher low when this happen we know that normally we are in an uptrend. We could easily identify an uptrend in an event that the bar's high for today is higher than its high the previous day
Also when the low of a financial asset be it stock or crypto prints a low that is higher than the low of the previous day then we could say that such an asset is in an upward trend
For me i think understanding the basic concept of what makes an uptrend makes it pretty much easier to know how to identify an uptrend bar trend. It is true we may not see a fine line being drawn but overtime or zooming out if we clearly observed that the bar chart has been following a pattern of higher highs and high Lows it's a clear indication of an uptrend.
 source
As the image shows this is the price bars of doge/usdt pair and if we clearly observed we could see that the price of doge on the daily time frame was printing a higher high bar and higher low accumulated overtime which indicates that we are in a bullish trend or uptrend
Identification Of Downtrend On Price Bars
A downward trend is when the price point of an asset prints a high that is lower than the previously recorded high and the low is also lower than the previously recorded low happening overtime then it is a downtrend when the bar over time prints a series of lower low and lower high then it's a downtrend.
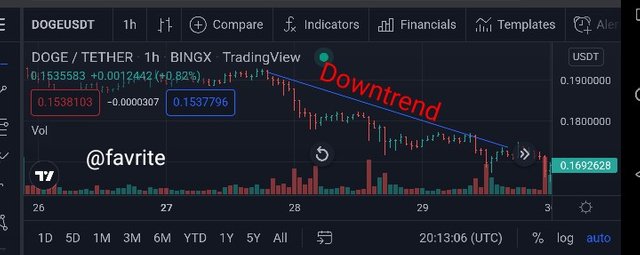
The image is showing a confirmed downtrend on the price of doge/usdt pair as we observed overtime the bar was printing a low lower than the previous low and a high lower than the previous high which generally leads or shows that the price of this crypto asset is in a confirmed downward trend.
The Bar Combinations For Spending The Day Inside For Both Conditions. (Screenshots required)
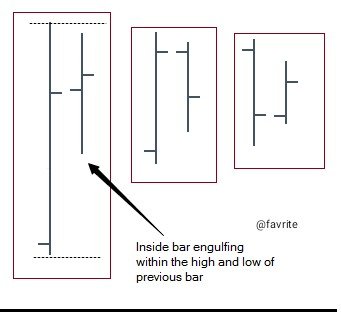
As the image clearly depicts the inside bar is being engulfed within the previous bar high and low and the inside day bar often implies a pause in market action often caused by indecisiveness from the buyers and sellers.
The inside day bar as the image shows is formed when the high is lower than the previously recorded high and the low is higher than the previously recorded low a kind of a boring price movement that is what this inside day bar pattern indicates when both the buyers and sellers are on hold.
The Bar Combinations Getting Outside For The Day For Both Conditions. (Screenshots required)
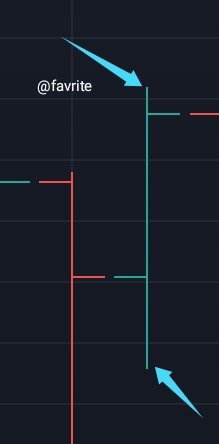
An outside day is when the new bar formed is outside the range of the previous day. The outside day bar could also be in the form of a trend reversal or continuation as the case maybe it usually forms when the new bar breaks the low or high of the previous day or we just say when it's outside the range of the quiet day then we call it and outside or getting outside for the day and this could be in bullish or bearish condition
For the bullish condition it usually forms after a red day and in this condition the open is usually at the low while the close is at the high which indicates a bullish bar and that also confirms that there is more buying activity than selling in other words the bulls are in control or have taken over the day.
 screenshot from trading view
And for the bearish condition it usually denotes the end of a trend or could also be formed to show a trend is continuing which ever the case. This bar is usually formed when the open is at the high and the close is at the low then we know we are in an outside day bear trend. Usually this happens when the bulls are weakened and unable to continue to push the price higher at that point those selling greatly overwhelm those buying in the case then we could say the Bears are in control for the day.
 screenshot from trading view
Explaining The Bar Combinations For Finding The Close And The open for both conditions in each trend. (Screenshots required)
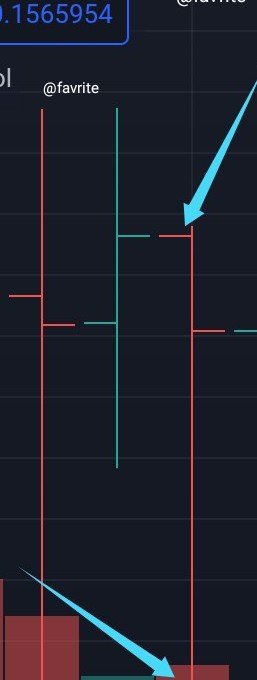
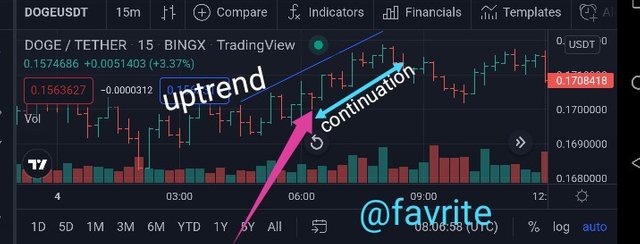
Now we will look at the bar combination for finding the open and close in the case of a trend continuation. When the market is in an uptrend this is usually identified when the open as well as the close is at the high of the vertical line when this happens it signifies that such a market is most likely to continue in its upward movement for a market that is already in an uptrend that is why it is for trend continuation.
 screenshot from trading view
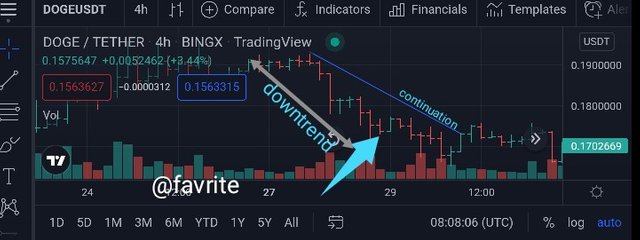
Now for finding the trend continuation in a downtrend it is done when we observed for a market that is already in downtrend that the open and close is at the low when this happens it's a clear indication of a downward trend continuation
 screenshot from trading view
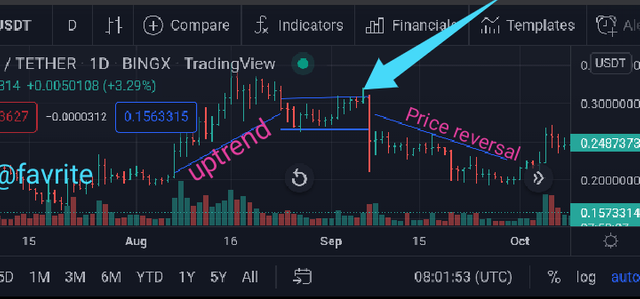
Identification Of The Close And Open In A Price Reversal
Well when it comes to identifying open and close for reversal we have to take note of the bar just like in continuation, in this case let's take for instance, say a market is in an upward trajectory and then at some point the price bar for both open and close prints at the low of the previous day it usually results in a trend reversal and leads to a down trend for a market already in an uptrend it reverses toward the downside but if it's was in a downtrend and the and the open and close prints at the high of the previous bar it leads to a price reversal in the upside that is how to identify price reversal for open and close
 screenshot from trading view
Conclusion
Knowledge of price bar and understanding what it means in different scenarios can help us immensely in our trading life to be a success and not to make mistake, this bar pattern is preferred by many in their charting as it help them gain a better understanding of the path the market is going to or the path the market is intending to follow and as such helps this traders to act accordingly to be in profit, it is a useful charting pattern i sincerely believe and learn alot much thanks to you prof @sachin08 for your timeless lesson God bless.
Hello prof @sachin08 my homework post is yet to be upvoted
Hello prof @sachin08 my post is just hours to payout and hasn't been curated yet