Crypto Academy Season 5 Week 5 Homework Post For Prof @sachin08: Trading Using Wedge Pattern

In My Own Words What Is Wedge Pattern
Wedge pattern are areas in the chart where the price action kind of gets quiet or consolidate as the case may be. Now this wedge patterns are easily spotted by isolating the pivot points atleast 4 consecutive pivot points showing the recent pivot highs and the recent pivot lows converging ontop of each other other while isolating two set of trend lines upon which the wedge patterns could be drawn. It kind of keeps the price action contained in the wedge pattern until breakout.
Wedge patterns is often being considered to be powerful considering how strong the breakout usually is, after formation of this wedge patterns the breakouts is usually powerful either to the downside or upside. Wedge patterns are a proven good tool for predicting breakouts and the wedge pattern kind of kinds the price containing allowing us to easily spot a breakout well before it happens.
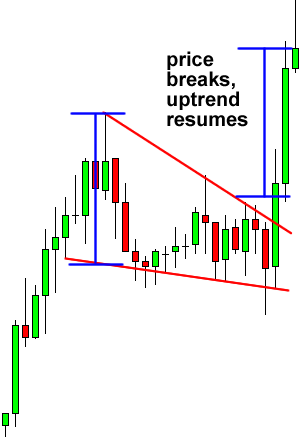
A typical example of what a wedge pattern could look like, in this case it follows a breakout towards the upside. Now we have two types of wedge patterns we will be looking into and they are the rising wedge and the falling wedge one denoting a bullish scenario and the other a bearish one.
Rising Wedge
Well the rising wedge is invariably a bearish pattern and in the formation of a rising wedge the price point prints higher high and higher lows but the support line is often steeper than the resistance line. In the formation of the rising wedge every new high is created with a lot of momentum and is signaling an underlying weakness.
The rising wedge has two basic variation which are the bearish reversal in this case normally we know in an uptrend the price makes series of higher highs and higher lows but as the bull trend is losing steam that is to say that the price has lost momentum and is barely struggling to push price significantly higher until the bearishness prevails and the price finally breaks downward which was originally in an uptrend an this is known as the rising wedge bearish reversal.
The second variation of the rising wedge is the bearish continuation and this one is usually formed after a downward trend as the price moves higher but since the main trend is bearish the upside movement of the price at that point lacks real momentum and at a point the price will eventually break downwards to resume the downtrend movement and the price target is usually the price of the wedge measured down from the breakout point
A typical example of a rising wedge
Falling wedge
The falling wedge is the opposite of a rising wedge, is a bullish formation pattern where the price points makes lower lows and lower highs and the resistance line is steeper than the support line and every new low is printed with lots of momentum often signaling weakness of the bears. This pattern is in two phase which are the bullish reversal pattern and the bullish continuation pattern.
For the bullish reversal pattern ordinarily we know in a downward trend the price prints a lower low and a lower high but as the bears are losing momentum the price points struggles to print a significantly lower price until the bullishness prevails and the price finally breaks out in an upward trajectory.
Now the second variation of this Pattern is the bullish continuation and is usually formed after a strong uptrend and at a point the price retraces lower though the main trend is still bullish therefore the price retracement to the downside eventually loses momentum and with time the price breaks out to the upside to resume the already established bull trend. The price target is usually measured from the height of the wedge measured up from the point of break out.
Example of a falling wedge
The breakout of these Wedge Patterns Does It Sometimes Prooduce False Signals? If yes, then Explain how to filter out these False signals
Yes there is always a probability of any chart pattern to result in a fake-out either as a result of misreading the chart or entering a trade without puting into consideration all the possible indicators or some other factors as well which could be neglecting the volumes while trading the breakouts.
Well a fake-out is when price action fails to sustain the breakout move and ends up moving toward the opposite direction and this could also happen while trading a wedge pattern.
Now how can we avoid this false signals or fake-out in trading well is kind of hard to completely avoid fake-outs or false signals while trading but we can minimize our chances or we can filter out this false signals to a no or minimum level.
To do this we need to;
Only trade breakouts with build up, a build up is actually when a price consolidates and gets tighter and tighter until it moves in smaller ranges which is actually a sign of strength as we see in our typical wedge patterns, because during this consolidation and movements in tight ranges it shows prove of a confirmed signal and a powerful breakouts happens eventually with out target getting hit in no distance time. Also to avoid false signals which should make sure to trade only breakouts with long ranges which is to say before entering a breakout we should make sure that the price point which is consolidating is consistently bouncing off between resistance and support in other to accumulate a strong momentum for its breakout, the longer the conslidation the stronger the breakout.
Also during breakouts there should also be a retest that is to say after the price breakouts it should retest on a previous resistance which should then acts as new support before the continuation of the price movement it's always good to see a swing high and swing low during breakouts so the support line will act as a floor to support higher price we are aiming for, and also to help filter false signals we should always wait for the confirmation candle either a bullish candle to confirm our support area or a bearish one to establish or confirm our resistance area depending on the trend and then we probably wait for another candle to confirm the continuation of this trend.
Lastly another thing we should watch out for is the volume usually during a breakout for the breakout to be confirmed it should be accompanied by high volumes i think ifnot there will be risk of a fake-out in that breakout and the price reversing back on us.
Trade Setup Using This both types of Wedges.( Entry Point, Take Profit, Stop Loss, Breakout)
Trade Setup For a falling wedge;
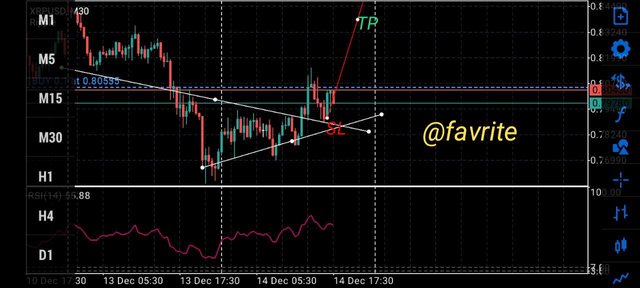 original pix from me using MT5 traders app
In the case of this breakout i put my buy order at the point of breakout around $0.80 and my take profit at $0.832 then i put my stop-loss slightly below the resistance line at $0.785 this is an xrp chart.
Trade setup using a rising wedge;
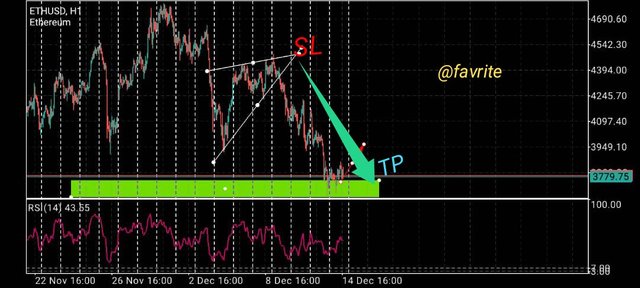 original pix by me using MT5 traders app
Well i had my buy order at the point of breakout at $4349 my stop-loss at $4542 and my take profit is at $3779 hoping it reaches the target and this is an ethereum chart
Conclusion
I think wedge patterns is one of the most accurate patterns in trading due to the fact that upon breakout it usually reaches its target fastly unlike some other patterns, i believe that the wedge pattern is a good chart pattern traders should look for as it has a high probability of success when it eventually breakout but at the same time traders should be careful to analyze a chart pattern very carefully before entering a position and determining if the indicators are in confluence with each other or not this will all help in making sure that this Patterns play out nicely well. Very happy prof @sachin08 for this homework task and happy i could contribute in my own little way.
Hello prof @sachin08 please 🤲 my homework post is yet to be curated and its steadily approaching payout
Please prof @sachin08 and @steemcurator02 my post is just hours to payout and is not yet curated
Cc:
@sapwood
@sachin08