Crypto Academy/S6W3-Home work post for kouba01
Good day steemians,how are you all ,my name is favrite,as I write to you again.it really been a great privilege given to me, being able to learn,and participate in this season's crypto academy ,because a lot of things ,information and knowledge I have gained through the academy ,and through our wonderful professors who takes out quality time to teach us good and wonderful contents that have been beneficial to me.
So I will be using this as an opportunity to give special thanks to our professor @kouba01 for this week's topic which is centered on The TRIX INDICATOR which I would be explaining and answering the related questions in the subsequent paragraph.
Before I begin all images were created and sourced by me
ok let us begin.

Based on my wide understanding and usage of this particular indicator ,TRIX INDICATOR as the name implies means Triple exponential average .
Trix indicator is an oscillator like indicator that is found at the bottom of a trading chart ,and just like how an oscillator acts, The TRIX is also used to check when a market is overbought or sold
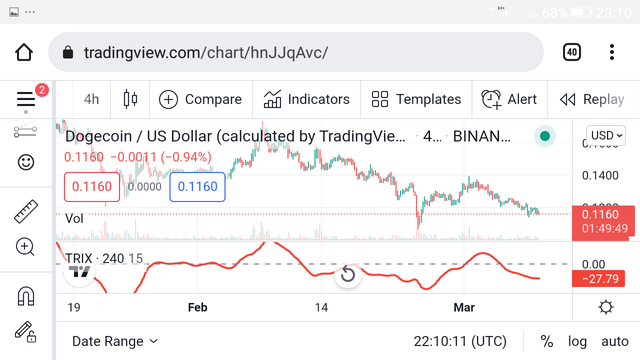
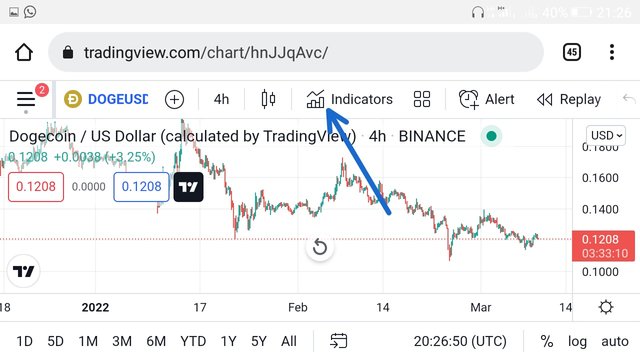
Image showing Trix indicator on doge/usd chart gotten from trading veiw
Source
Also the TRIX indicator is a leading indicator signal that acts as a momentum indicator , when I say momentum indicator I mean the TRIX indicator show or tell when a particular market is in it trending phase be it an uptrend or downtrend it shows and give us the directional move of the market.
The mechanism of Trix indicator oscillates over the zero line which acts as a base line it indicates that the market is in the positive value or in an increasing momentum which means that as the Trix oscillates above the zero line it gives traders a signal to buy or it tells them that the market is in an uptrend
Also likewise when the Trix crosses just below the zero line it indicates that the market has now entered a negative value or a decreasing momentum which in turn gives traders signal to sell the market or indicate a start of a down trend
Due to research conducted by me and also confirmed from professor @kouba01 there is a formula which we can apply in calculating the TRIX INDICATOR, but although the Trix is automatically calculated and inputted as a indicator tool in trading view I strongly think it best we learn how to calculate it ourselves .
In carrying out this task I will be making use of a graphical representation on DOGEUSD PAIR on the 4h time frame.
This chart above is a chart with length 20 which is I changed from it default settings
Trix being a tripled smoothed EMA that is a moving average on a moving average on a moving average(EMA3) which majorly filters out lot of noise made by price movements
From what we were taught by our professor and confirmed by my research, the formula used in calculating Trix indicator is
- Trix=(EMA3t-EMAt-1)/EMAt-1
This formula can be broken into 4 steps
The 20-period exponential moving averages(EMA) making use of closing prices
The 20-period exponential moving averages(EMA)of the result gotten from step1
The 20-period exponential moving averages(EMA)of the result obtained from step2
1%-period change of step3
This calculation can be used on all period knowing that the Trix fluctuates from period length to period

Below is how I configured my Trix setting and change my period from default to my desired which is 20-period length
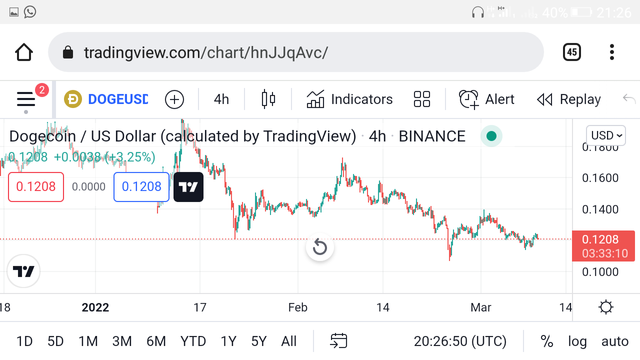
I opened trading veiw on my chrome browser and opened up a chart of DOGEUSD
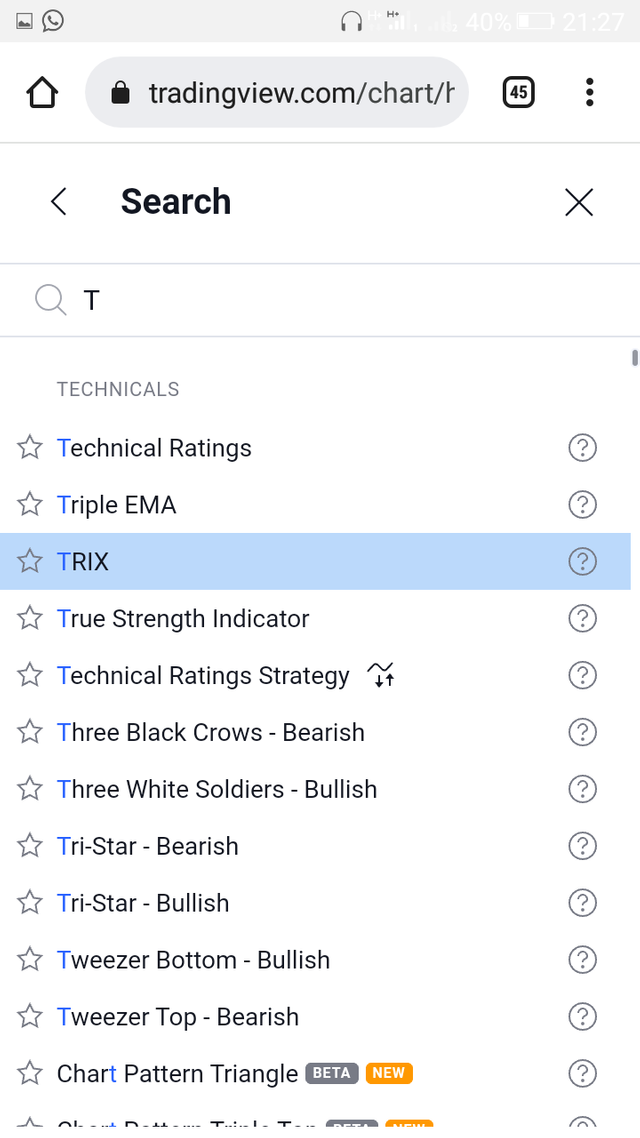
I clicked on indicator setting tab and searched for the indicator I was looking for which is Trix
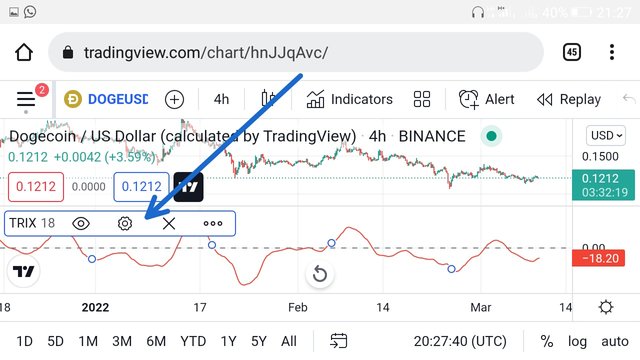
When it popped up on my chart I clicked on the setting icon and
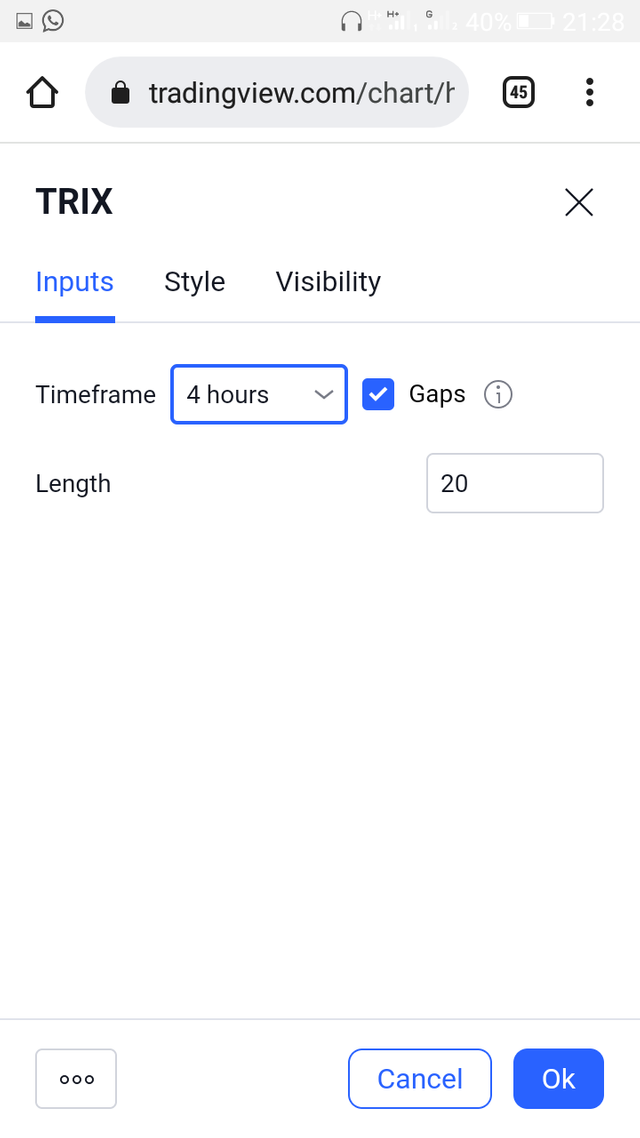
Then I changed the length being from 18 to20 and set the timeframe view to 4 hours
That was how I was able to configure the Trix indicator to length 20-period
IS IT ADVISABLE TO CHANGE IT FROM DEFAULT SETTING
from my own perspective I think yes, because it is based on the time frame a trader is analysing on if If you are a swing trader and you analyze on the daily and weekly chart a 40- period might be good but for a day trader a lower value of Period from 10 to 20 might be a good
because increasing in the number of Period is very good for swing because of the less sensitivity of the trix but decreasing the number of period is best for day traders and skull part because of the increased sensitivity of the market in a lower time frame
Just as said above which we know that the trix indicator can indicate a buy and sell signal ,but how do we identify when to buy or sell in the right area and a good entry.
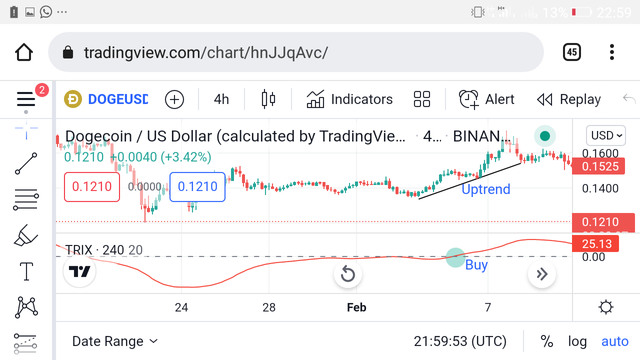
For a buy signal the Trix indicator needs to move above the zero line which acts as the base we can enter a buy entry from there after it break above the zero line
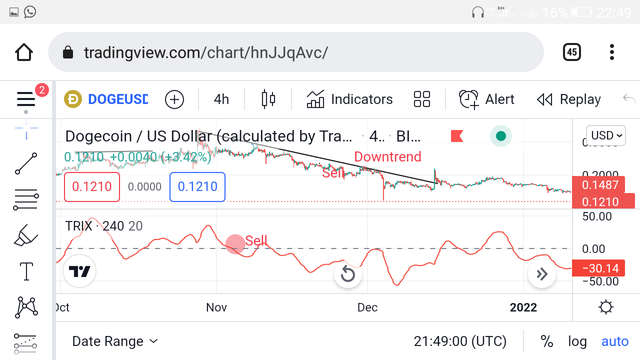
For a sell signal the Trix indicators needs to oscillates below the Baseline in decreasing momentum then we can take our entry just below the zero line
To enter a trade we must I have a confirmation of price action wether a breakout ,retest , pullback or trend reversal ,because we know that some indicators although are good what we mostly cannot rely on them solely
although the trix filter a lot of noise but sometimes it gives out fake signals that is why we need to confirm price action to get our entry
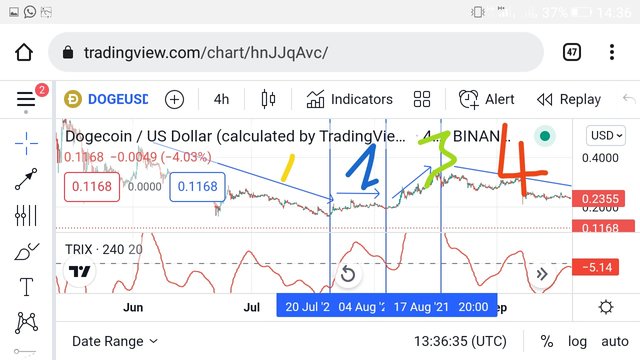
from this screenshot above we can see that in a longer-term the direction of DOGEUSD is bearish which will be beneficial if one is a swing Trader but during that downtrend we had series of pullback that formed an uptrend.
going to the chart in part 1 we saw that the overall trend was bearish and the trix line went below the zero line given a signal to sell the market .
Part 2 the price was seen to have consolidate as sellers loses momentum but the Trix indicator was seen above the zero line giving a false signal to Traders to buy the market.
in part 3 the indicator was first seen going below the zero line before a turn about to the upside which would have exited a lot of Traders who initially entered a sell market due to the trix indicator .
also in part 4 we could see the trix indicator below the zero line due to the down trend that started we also saw the tricked going above crossing the zero line before continuing its downtrend, that signal would have edited a lot of Traders, who thought it was a signal to buy the market .
So the trix limitation is that it cannot be stand-alone indicator because it does not give a proper entry position .
Another limitation is that it produces a lot of false signal if not confirmed by price action.

The Trix indicator is an oscillator that is similar to the MACD but have a great difference in between them and the difference is that the trix is more smother than the MACD and filter out more noise than the MACD
The MACD is more sensitive to price movement and move a little faster ,The Trix tends to move bit later after price have moved in that sense Trix does not show every pull back .
For example if market is in bullish that is and uptrend it filters noise of the unimportant pullback which is a good signal for traders.
The MACD is a momentum indicator that indicate strength change. The MACD can be very useful when be paired up with the Trix in the sense that pairing the two of them can provide Good signals for trend reversal breakout and even pullback
one of the signals one can look out for when combining the two indicator is that for example to place a buy order using the two indicator which is Trix and MACD our entry can only be placed if the TRIX crosses over the MACD and crosses over the zero line that is the signals to look out for when looking for guys with MACD and the trix

Divergence is another useful entry signal criteria using the Trix INDICATOR,
So combining divergence and zero line cut off gives us a better directional move of the market it tells us when our eventual reversal is about to take place
divergence with Trix indicator happens or occur when price action and the trix indicator contradict each other .
we have two types of divergences and both of them work well with the trix indicator.
BULLISH DIVERGENCE: when price makes a lower low but the trix does not instead it makes series of higher highs we say that a bullish divergence is formed
BEARISH DIVERGENCE:when price makes higher high and the trix produces a series of lower lows we say that a bearish divergence is formed
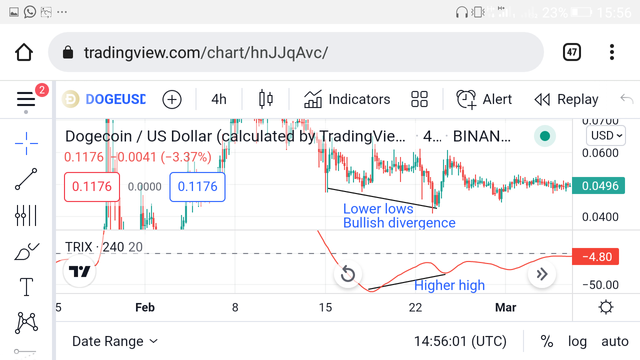
We can apply and combine these zero line cut off and divergence to give the actual and direction off the market for instance in the screenshot we see that price made lower lows while the trix indicator was making series of higher highs and we know that a bullish divergence only occurs when price makes the lower low but the trix makes higher highs
and we know that bullish divergence only occurs when price makes a lower low but the Trix makes a series of higher high the price tends to change it trend from bearish to bullish we can place an entry for a buy position when the TRIX oscillates just above the zero line with confirmation of price actions.
As we know that there is no indicator or system that is 100% efficient in trading and although the trix being a leading indicator and filters out noise than other EMA but it doesn't give proper entry position and does not show us a proper exit position.
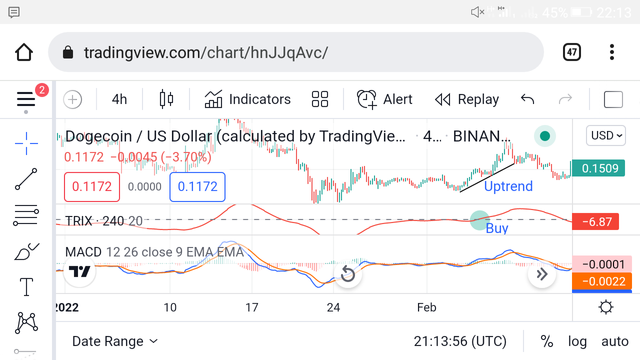
So yes I think it is really best to make use of Trix with another filter like indicator like the MACD indicator
The MACD indicator being a momentum indicator that is popularly used for trading it identify trend reversal and it is used to check when price is overbought or sold
Combining the two indicator helps to avoid false breakout and give a proper entry and exit position
The screenshot below is a good example of when the two are being used together
No matter how good a system is there is always a bad side to it because there is nothing that is 100% perfect
THE TRIX indicator also have it pros and cons or less call it ,it advantages and disadvantages the things we ought to look out for using this indicator
THE ADVANTAGES OF TRIX INDICATOR
it is a leading indicator which gives adequate information for trend reversal and breakout
It filters out a lot of unimportant noise of o price movement
It operation on how to use and how the Trix works are easy to understand
It is really an effective tool to spot divergence
THE DISADVANTAGES OF TRIX INDICATOR
IT not a stand alone indicator and can not be reliable alone
It gives false signal if not properly confirmed with price action
It does not show a proper position to place and entry and doesn't give a position for exit
The TRIX INDICATOR is one of the best but not widely known leading indicator even amongst most steemains on this platform but now we all are fully aware of The Indicator Trix and how to apply it in our trading career for a better result
Thanks all who took time to go through my post