Steemit Crypto Academy Season 3- Week 7 I Analysis and Trading with the indicators "Stochastic Oscillator +" Parabolic SAR "
Hello everyone. This is @farooq2923 with a new homework which is about the "Analysis and Trading with the indicators "Stochastic Oscillator +" Parabolic Sar ". Before starting, i am thankful to the professor @ lenonmc21 for this amazing lecture.
.png)
1.Define in your own words what is the Stochastic Oscillator?
We know that multiple tools are use in trading world for analyses of chart. We first analyze the chart to get the high reward. The analyzing tool help us to save our money from drowning and from any high loss. The Stochastic Oscillator is also one among those tool which we use to analyze the chart while trading. This tool was introduce by the George Lane. The use of this tool help the traders to do the trading successfully.
Many other tools are also use but the problem is not any tool give you the hundred percent accuracy. But if we combine two tools and then do analyzes, it may result much better. But this problem is not occur while using the Stochastic Oscillator. We do not need to use any other tool with this one to get the good result. The output is not 100% accurate but this alone give as much better result as the other tools give you when we combine them. This tool do not need to be supported by any other tool. This tool help the traders to make the trading decisions which are best for them.
.png)
How Stochastic Oscillator work
The price of an asset goes up and down with passage of time. But knowing the support and resistance level of any asset, the trader can perform good trading. This indicator work within 0-100 range. The trader look at the chart and see what is the current price of an asset. Then they combine the current price of coin with its past price and determine whether it is oversold or over bought region in market. The oversold and overbought information help the trader to determine whether they should enter into market or leave the market.
The best thing of this indicator is we do not need to support this indicator with any other indicator as we do while using other tools. Because this indicator solely give you the best result by giving you the information of highest and lowest price of an asset within specific period of time. Then we compare the price with its previous level price and determine what to do next.
2. Explain and define all components of the Stochastic Oscillator (% k line,% D line + overbought and oversold limits).
There are two line in Stochastic oscillator. The uptrend and downtrend are determining by looking at the direction of these lines. The k line is usually shown in blue color and the red line in chart show the %D line. The k line is faster as compare to D line because it show quickly whenever a change in price of an asset occur. When the K line goes up, it mean the market is going up and the price of asset is rising. And when the K line is start falling down after crossing the D line in stochastic Oscillator, it mean that the price of asset is falling down and downtrend has been started.
The uptrend is good time for traders to sell their assets to get the high reward and downtrend is good time for traders to buy the coin because the price of coin is low in downtrend.
%k line
This is the fast line as compare to %d line in stochastic oscillator.
The formula of %k line is
% K line = (CP-Ln/Hn-Ln) 100
Or
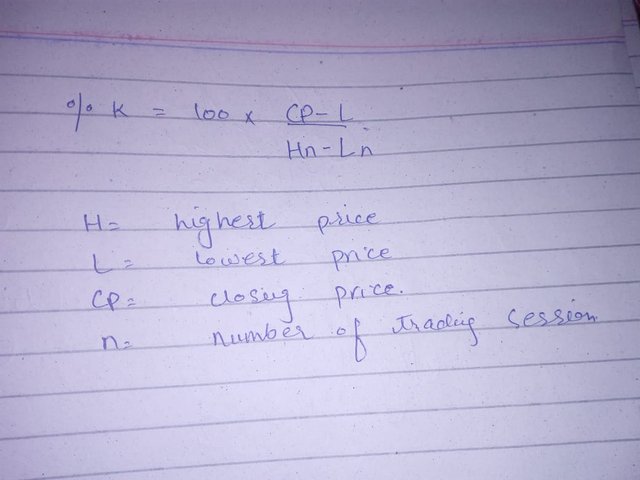
- Here the CP in the formula show the recent closing price of a coin
- The Ln in the formula show the Lowest price of a coin within a period of time
- The HN show the highest price of coin within a period of time.
To obtain the value of %k line, we need to minus the lowest price of an asset within specified period of time from its current closing price. Then we divide the result between the difference of highest and lowest price of coin within specified time period. At the end. The obtained number is multiplied by the 100 to get the value of %k.
%D line
The %D line is slow as compare to the %K line because it do not show the quickly the change in asset's price. %D line is also known as the moving average line of %K line. It is shown as the red line in chart. The formula of %D line is
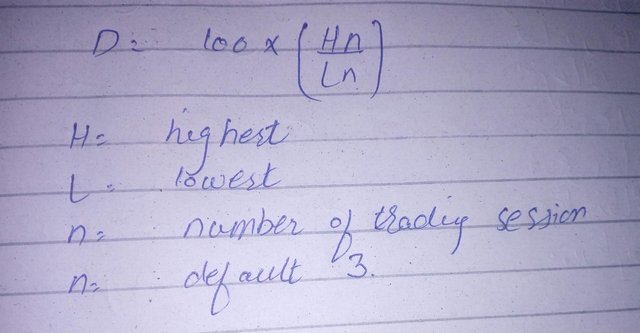
%D Line = Average % K / 3 periods
To obtain the %D line, we divide the value of average K with 3 period. We can also get the value of %D line by dividing the highest price of asset within last 3 trading level with the lowest price of asset within last 3 trading level. Then the obtained value is multiplied with 3 to get the final value of %D line. Another formula is:
Overbought Position
We have mentioned above that the Stochastic Oscillator is bounded within range from 0-100. When the Stochastics Oscillator is seen above the range 80, it is known as the over bought position in the market. This help the traders to make the trading decision. The trader should sell their invested coin because this position show that market is in uptrend. And after every uptrend, there is a downtrend. So downtrend is next so the coin should be sell to get the high profit.
Oversold Position
When the Stochastic Oscillator is below than the range 20, the market is said to be in oversold position. The oversold position is best time for trader to buy the coins because price of coin is low at that time.
3. Briefly describe at least 2 ways to use the Stochastic Oscillator in a trade.
The Stochastics Oscillator is use to determine the market uptrend and downtrend. The traders make important decisions looking at the direction of the %K and %D lines.
The %D line shows the moving average of three days and the %K line shows the value of Stochastic oscillator. When the %K line cross the %D line and start moving upward, its mean that uptrend is started. This is usually the right time to invest in coin because the market is moving up and price of coin will rise in future. If %K line cross the %D line and start moving downward, its mean the bearish trend is going to take place. The bullish trend is end. It is right time for traders to sell their coins to get the high profit.
So in this way the Stochastic Oscillator help the traders to find out the market trend. Looking at the market direction, the traders decide their next move in market. They buy or sell their coins according to the market moves.
Not only this, but by knowing the market trend, this indicator help us to know about the market demand and supply. If market is downtrend and %K or blue line is moving downward after crossing the %D line, its mean that the supply is high and demand is low. At this stage the price of coin is low. And if market is uptrend and blue line is moving upward, its mean that the demand is high and supply is low. This stage show that the price of coin is rising.
We can use this indicator to know about the market support and resistance level. This help the traders to make their trading decisions. By knowing this, we can perform our trading in more best way.
4. Define in your own words what is Parabolic Sar?
The Parabolic Sar is also an indicator which we help us to make the best trading decision in market. This indicator is also use by many people in market and it is use to show the change in market price.
The SAR stand for stop and reverse The Parabolic SAR use to find out the point where the price stop and reverse. So in this way it help the traders to find out the change in price direction. This indicator is represented on chart with a series of dots. When you see that the dots are above the current price of the coin, it mean that this is a uptrend in market. And if your see the dots are above the current price of coin, its mean that there is downtrend in market.
.png)
This indicator also help us to determine the market entry and exit spot. When the dots are above the market current price and its market downtrend, then it is best time to enter into the market. And when the series of dots is below the market current price of coin and market is at its uptrend, then it is best time to exit from the market.
This tool give you more accurate result when you sue this with other tools. This tool help to indicate the direction of market. And thus the traders make their trading decisions accordingly.
Uses of Parabolic SAR
- Use to determine the market trend
- Use to determine whether its entry spot or exit spot
- show the Change in market price and price direction of an asset.
5. Explain in detail what the price must do for the Parabolic Sar to change from bullish to bearish direction and vice versa.
We have mentioned above that the Parabolic SAR is use to determine the price reversal and trend in market. It is shown on chart by a series of dots. These dots position on the chart indicate the trend of market.
Downtrend to uptrend
We know the candles are there on the chart. The direction of candle shows the direction of market. When the dots are above the market price of coin or candlestickes, its mean that the market is at its downtrend. The downtrend is the good point for traders to buy the coin. The price of coin is low. The demand of coin is low and supply is high which causes the low price of coin in downtrend. When people will invest in coin and will buy the coin at low price, the demand will increase and trend reversal will start. At this time, the series of dot will be above the candlestick. The trend will change from downward to upward when the price of coin will touch the parabolic SAR and start moving upward.
Uptrend to downtrend
When the dots are below the market price of coin or candlestickes, its mean that the market is at its uptrend. The uptrend is the good point for traders to sell the coin because selling coin in uptrend is highly profitable. The price of coin is high in uptrend. The demand of coin is also high and supply is low which causes the increment in price of coin in uptrend. When people sell their coin to get the reward in uptrend, the demand will decrease and trend reversal will start. The trend will change from bullish to bearish. At this time, the series of dot will be above the candlestick. The trend will change from upward to downward when the price of coin will touch the parabolic SAR and start moving downward.
6. Briefly describe at least 2 ways to use Parabolic Sar in a trade?
Market Entry or exit Spots
The parabolic SAR is efficient to indicate the entry and exit spot of market. When the market bullish trend is about to change and price of coin take reversal and will start moving from upward to downward. The investors who have invested in the asset will find it a good spot to sell their coins at high price because the uptrend is reversing and changing into downtrend in future. So they sell their coins and earn profit. It is a good spot to exit the market. The dots will be then shift from below the candle stick to above the candle stick.
When the traders sees that the price touch the parabolic SAR and start rising upward, they find it a good spot to enter into the market.
Trends of Market
This indicator help also to find out the current market trend. If series of dots is below the price movement, its mean that the market is at its uptrend. And if series of dots is above the candle sticks, it mean that the market is at its downtrend.
Practice (Only Use your own images)
1. show a step by step on how to add the Stochastic Oscillator to the chart (Indicating the% k Line and the% D Line, the overbought and oversold zone.
1- Login into Tradingview.com
2- Click on the chart. A chart will be appear
.png)
3- Click on the Fx on the top bar in chart.
.png)
4- Search for Stochastic Oscillator.
.png)
5- The Stochastic Oscillator lines will be shown in your chart.
6- The red lines are showing the %D line and blue line are %K lines. When the %K line cross the %D line and start moving downward, the market downtrend start. and when %K line start moving upward after crossing %D line, the market uptrend start then. When the lines are below to range 20, the market is at its downtrend and bearish season. When the lines are above the 80 range, the market is at bullish trend. When the blue line is moving up, its a buy signal and when blue line is moving down, its a sell signal.
2. Show step by step how to add Parabolic Sar to the chart and how it looks in an uptrend and in a downtrend.
1- Login into Tradingview.com
2- Click on the chart. A chart will be appear
3- Click on the Fx on the top bar in chart.
4- Search for Parabolic SAR.
.png)
5- The Parabolic SAR dots will be shown in your chart.
When the Parabolic SAR dots are below the price movement or candles, its mean market is at its uptrend. And when the Parabolic SAR dots are above the price movement or candles, its mean the market is at its downtrend.
Add the two indicators (Stochastic Oscillator + Parabolic SAR) and simulate a trade in the same trading view, on how a trade would be taken
.png)
In the above screen short, i have added both indicator in the same chart. Both the indicators are moving with the movement of price. Now i will simulate a trade in the same trading view.
.png)
In the above screen short, i have decided to buy the coin at the spot which i have mention in the screen short. You can see that the blue line is moving downward and the parabolic SAR dots are also below the candles or price movement. SO it is market downtrend and a good spot to buy the coins because the coin price is low here.
.png)
In the above screen short, when the %K and %D line cross and the %K line start moving upward, i have decided to sell my coins because the market is rising and price is also rising . It is a good spot to sell the coins. The parabolic dots are also above the 80 range. So its mean it is market uptrend and a good spot to sell the coins.
Conclusion
The Parabolic SAR and Stochastic Oscillators are widely use t determine the direction of price. The traders use this to make the trading decisions. Both indicator help the traders to perform the successful trading. The Stochastic oscillator has two lines. The blue line and the red line. When blue line is moving upward and range is above the 80%, the market is at uptrend. And when range is below 20 percent and blue line is moving downward, the market is at its downtrend
The parabolic SAR is shown by the dots in chart. When dots are below the candlestick, the market is at its uptrend and when the series of dots is above the price, the market is at its downtrend.
Cc: