Crypto Academy Season 03 - Week 06 | Advanced Course - Trading Liquidity Levels The Right Way - Homework post for @cryptokraze

Question No. 1:
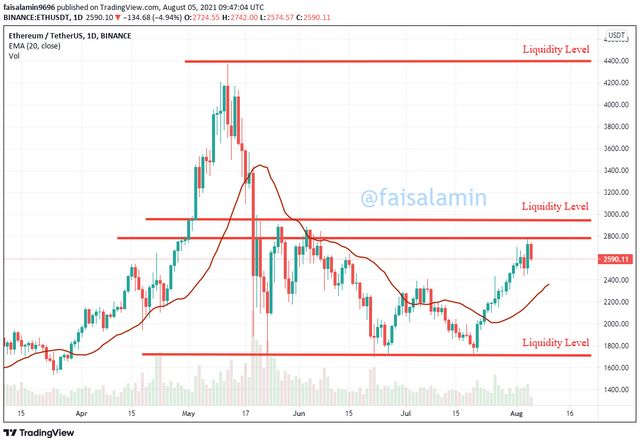
What is your understanding of the Liquidity Level. Give Examples (Clear Charts Needed)
What is Liquidity?
All liquid resources share that they all have a speedy worldwide market that might exchange them. It implies that these resources are generally exchanged on different trades all through the world at predictable qualities. Non-liquid resources are not regularly traded on open trades and are rather traded solely.
It implies that non-liquid asset costs may fluctuate drastically, and exchanges can consume most of the day to finish. We can conclude that it is hard to change one coin into another, or cash will contain more liquidity. In terms of cryptocurrencies, it means that convert crypto into cash or to another coin. A high rate of liquidity is preferred as it will give us these advantages.
Liquidity Levels

Traders put the stop-loss to a certain level so they can close the pending order to stop the loss in trade. In the same way the there will be a profit limit and when the market hit that level the order will be executed and profit will be added to the wallet.

Question No. 2:
Explain the reasons why traders got trapped in Fakeouts. Provide at least 2 charts showing clear fakeout.
What are Fakeouts?
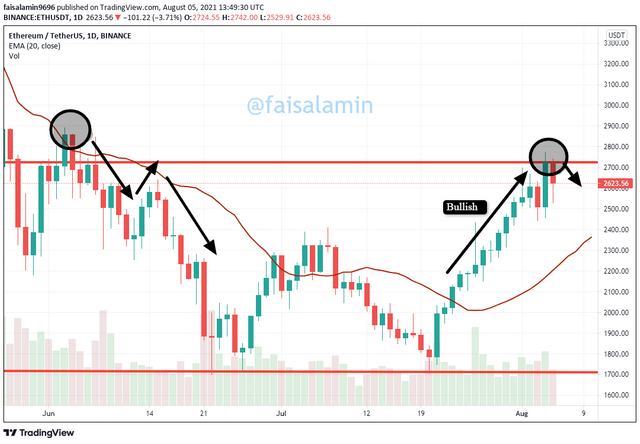
We can define fakeouts as if price breaks a support/resistance level and instead of trending in that direction goes back into the trading range. Then what happens is that the price goes up into the trading range. Here we have two clear chart examples.
In ETH/USDT we have a bullish example. In the chart, we can clearly see the resistance red colour line the price break the resistance but instead what happened is that it started trending down and it just went all way down as though this breakout is not valid and it is called a fakeout.

- Traders may think that the price breaks the resistance level and now it will be in an uptrend but what happened is that it started trending down and it just went all way down. That is why traders are trapped by this fakeout.
Here is another example of BTC/USDT we can clearly see the fakeout as we discussed earlier. Fakeout points are highlighted and we can see that how it fake out the price. This is the reason that when the price breaks the resistance we may think that it will go up but suddenly a fakeout there and the downward trend starts.

We can also get the fakeout easily by applying the Multi-Time Period Chart with default settings.
here is the screenshot that how we can apply it on the chart.

Now we can easily get the fakeout as we can see in this ETH/USDT chart screenshot.


Question No. 3:
How you can trade the Liquidity Levels the right way? Write the trade criteria for Liquidity Levels Trading (Clear Charts Needed)
To avoid fakeouts and trade liquidity levels in a good way we need to focus on Market Structure Break (MSB) or Break Retest Break (BRB) strategy.
What is Market Structure Break (MSB)?
In a simple way market structure is the movement of price in a pattern as the market always follows some type of traceable pattern. Market price swings between higher high and higher low.
here is an example of an ETH/USDT chart with MSB strategy and pattern.

What is Break Retest Break (BRB)?
When the market is bullish or in a bearish trend then there can be a retest, for example, the market break resistance and it becomes the support and there will be a new resistance level created there we called this situation Break Retest Break.
The best entry is when the market hitting a resistance level and then a re-test occur. We need to wait for this re-test to get the best possible entry/buy position.

Now it is clear that the best way to trade the liquidity level is when a proper MSB or BRB is formed. It is a good way for the proper entry or exit time. After the formation of MSB or BRB, we should trade according to the defined strategy to get a successful trade and not to be trapped in fakeouts.
We can also get the fakeout easily by applying the Multi-Time Period Chart with default settings.
Here we easily get the fakeout as we can see in this ETH/USDT chart screenshot and the applying procedure as described earlier.


Question No. 4:
Draw Liquidity levels trade setups on 4 Crypto Assets (Clear Charts Needed)
1) ETH/USDT Liquity Levels

2) BTC/USDT Liquity Levels

3) ADA/USDT Liquity Levels

3) BNB/USDT Liquity Levels


Conclusion
- Liquidity refers to how a given asset could be bought or sold without manipulating the price’s total constancy.
- Fakeout: if price breaks a support/resistance level and instead of trending in that direction goes back into the trading range.
- Traders may think that the price breaks the resistance level and now it will be in an uptrend but what happened is that it started trending down and it just went all way down. That is why traders are trapped by this fakeout.
- we should trade according to the MSB or BRB strategy to get a successful trade and not to be trapped in fakeouts.
- We can also get the fakeout easily by applying the Multi-Time Period Chart with default settings.