Steemit Crypto Academy Season 3- Dynamic Course for Beginners - Week 7 | Analysis and Trading with the indicators "Stochastic Oscillator +" Parabolic Sar " By @fabiha

Hello, Guys, I am Fine hopefully you all are also fine there is my homework task let's Start.

1. Define in your own words what is the Stochastic Oscillator?
2. Explain and define all components of the stochastic oscillator (% k line,% D line + overbought and oversold limits).
3. Briefly describe at least 2 ways to use the Stochastic Oscillator in a trade.
4. Define in your own words what is Parabolic Sar?
5. Explain in detail what the price must do for the Parabolic Sar to change from bullish to bearish direction and vice versa.
6. Briefly describe at least 2 ways to use Parabolic Sar in a trade?

Stochastic oscillator was developed in 1950 by a technical analyst named George Lane and stochastic remains a very popular technical indicator to this day and some further points than about the stochastic oscillator like the relative strength index(RSI). The Stochastic oscillator gives indications of when it thinks the market is overbought and oversold it does this by looking at the current price and comparing it to the price in the past to look back period the difference here is that the stochastic oscillator in that look bag is not just comparing the price to previous price levels but it's factoring in highest high and the lowest low across the period of its look back in making its comparison and the value of the oscillator is bounded between the 0 & 100.

The calculation behind the stochastic oscillator so we have the % K line that is calculated according to this formula
% K line
% k = (C-Ln/Hn-Ln) x 100
First of all, we have C which is the current closing price it will be subtracted to Ln which is a Low Value that's the low across our look backstretch of time across n periods and then we divide through that number by Hn i.e High over N periods- that Ln low value and then we multiply the number by a hundred to give ourselves our Percentage K where n is the number of periods.
C= Current Closing Price
Ln = Low value
Hn = High Value
where,
n = number of periods
for I look back comparison and the default value for n with trading 212 apps is 15 so you're looking back at the lows and the highs across 15 periods.
% D line + overbought and oversold limits
% D that is calculated by this formula
%D = Average % K / over d periods
then percentage D which is sometimes called the signal line which is an average of percentage K values over d periods and the default for d is 3 that's pretty much a standard value that's always used for Default 3 and it basically means that our second online percentage D it's just a kind of smooth down version of a percentage Kline.
OverBought and oversold they both use as an indication of potential reversals in price.
OverBought and OverSold indications is a very basic usage and that could be as simple as seeing the oscillator move like here into the overboard zone just making a note that one of your inputs is telling you to keep an eye out for a possible top in the market or another way to interpret that might be as crossing over into over boards is your preliminary warning and then dipping out of over boards could be a sell signal and vice versa here the oscillator dipping into oversold could be a preliminary warning of a possible bottom and then climbing back out of oversold could be a buy signal.
It can be used as a momentum indicator which is comparing a particular day closing price of a security to the range of price over a certain period of time so it is used in technical analysis when the stock is in uptrend about the closing price will be trending to trade at the high price at the end of the day whereas if the price as a downward movement the closing price tend to close at the lows of the day.
It can be used as finding out the overbought and oversold position in a particular stock and it will be used to find out the relative strength of the stock with respect to other indices so it will be helpful in finding out the upward and downward trend of the stock also and momentum associated with those upside and downside.
Economic intuition behind this measure is that it is a favorite technical indicator as it will be useful in finding out various Trends of stocks as well as particulate sector and it can be easily perceived by various nontechnical investors as well so it will be helpful in macro Trend analysis also so it is also favored by the economist.
This is an indicator that a lot of people really like and in its concept, it's one of the most simple and easy follow indicators. Basically, this indicator was developed by J. Wells Wilder, created well. First of all, SAR Stands for Stop and Reverse and some people consider it a trend following indicator and it can be used for that. This indicator aims to find the potential reversals in the market price direction.
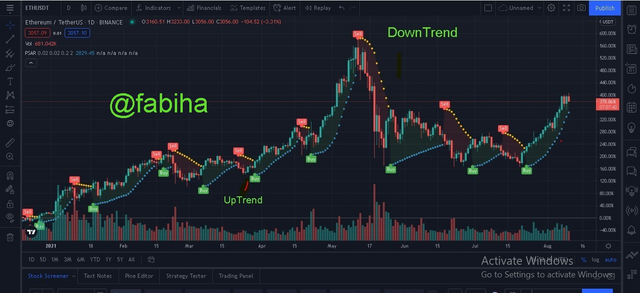
Parabolic Sar is usually displayed on a chart as a series of dots both above and below the price. When the dots are above price these signals are downtrend in the market and when the dots are below price these signals are uptrend in the market. When there is a change in the direction of the dots either switching from below the price bars to above or from above the price bars to below this can provide us with a potential trade seed signal.
The parabolic SAR is an apparatus that is addressed by a dotted line in the chart and is utilized to progress from a bullish to a bearish direction.
This implies that when the dotted line shows up underneath the candle, the merchant might buy resources, and when it changes position from beneath the candle to over the following candle, the broker can sell resources.
Parabolic SAR is a lagging indicator as it requires a calculation of price in order to plot on the chart and it is good to have an understanding of the calculation of any trading indicator you're going to use by understanding it you will be able to find the nuances that are associated with each indicator you use.
I will also Explain this on uses
The formula for Parabolic SAR is:
SARn + 1 = SARn + ? (EP-SARn)
Where,
SARn = current period,
SARn + 1 = next period Value,
EP equals the extreme high or low value in the current trend,
A = Acceleration Factor.
Source
The Two Ways to use Parabolic SAR are:
- Entry Signal generator
- Exit Signal generator
Entry Signal generator
The first way we can use this indicator is as an entry signal generator when the dots switch from being above price to being below price this provides us with a potential buy trade opportunity and when the dot switch from being below price to the above price this provides us with the potential sell trade opportunity.
However, it's very important to note the following point we do not just blindly enter a trade every single time the Parabolic SAR gives us a signal Instead we're going to establish a trade idea with what we see on the charts first, and then we are going to use the Parabolic SAR to confirm our entry.
So let's go through a trade example of this here we have a market that is moving sideways and then put in a sharp momentum move to the downside we hit a level of support and bounce off two the upside price stops here and rejects down forming a level of resistance the market then spends a good amount of time ranging between these two levels of support and resistance alright now let's add the Parabolic SAR to our charts you'll notice that the dot switch from being above and below price many times while the marketing was stuck in this range this is what we talked about earlier when we were discussing false entry signals so the way we get around this is by waiting for the price to break outside of this range before or looking for an entry opportunity with a Parabolic SAR.
So in this case we get a confirmed breakout to the upside hereafter this happens we are going to confirmed that the dots on the Parabolic SAR up below price signaling and uptrend than we would place a buy trade for our exit location we would look for a level of resistance higher up in this example we have a short term level of residue resistance here that had multiple touches earlier price reaches this location fairly rapidly before pulling back and continuing even higher.
Exit Signal generator
The second way we can use the Parabolic SAR is as an exit signal Generator Here we have a market that bounces off support for the second time right here if we entered a buy trade in this location we can use the Parabolic SAR as an exit signal Now there are a few ways you can do this for one of the best ways is to wait for three consecutive dots against the direction of your trade before exiting So in this example we answered a buy trade so we would wait for three consecutive dots to appear above the price before exiting the trade we see a fairly strong move up breaking through resistance and then continuing even higher eventually we have three consecutive dots appear above the price right here so we would use this opportunity to close our buy trade if instead, you had placed a sell trade then you would simply wait for the opposite to occur which in this case would mean three consecutive dots to appear below the price you can even use the parabolic acid dots to appear below price you can even use the PowerBolic SAR to trail your stop loss here's how to do it?
If you entered a buy trade then you would place your stop loss on the dot that is underneath the price at your entry location. As the dots on the Parabolic SAR move upwards, then you would move your stop loss up alongside them Eventually price will move down and hit your stop loss taking you out of the trade.
If you entered a sell trade then you would do the opposite, by placing your stop loss on the dot that is above the price at your entry location and moving your stop loss down as the dots on the Parabolic SAR move downwards too.
Practice (Only Use your own images)
1) It shows a step-by-step on how to add the Stochastic Oscillator to the chart (Indicating the% k Line and the% D Line, the overbought and oversold zone.
2) Show step by step how to add Parabolic Sar to the chart and how it looks in an uptrend and in a downtrend.
3) Add the two indicators (Stochastic Oscillator + Parabolic Sar) and simulate a trade in the same trading view, on how a trade would be taken.
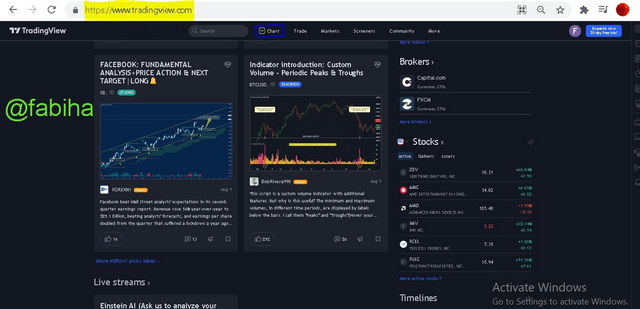
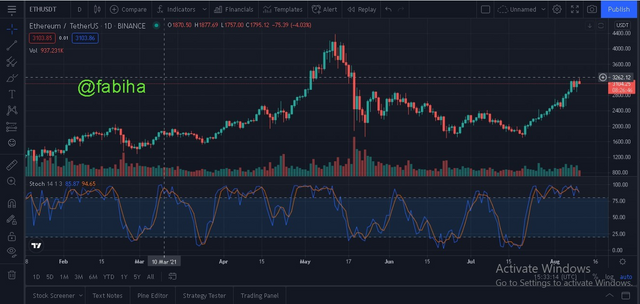
To add a stochastic oscillator to that chart, I will be visiting tradingview.com
then click on trade as shown in the picture
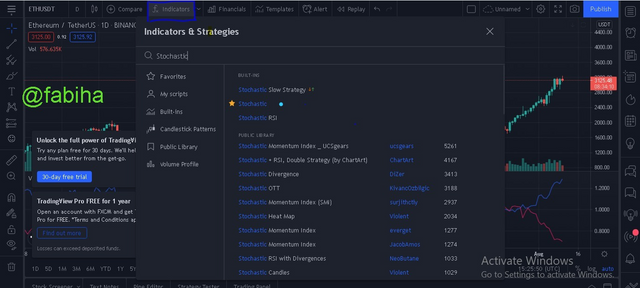
After clicking on the chart see on top now click on the indicator as shown in the picture.
After clicking on the indicator here is the search option now, search Stochastic oscillator I will star it now click on Stochastic Oscillator
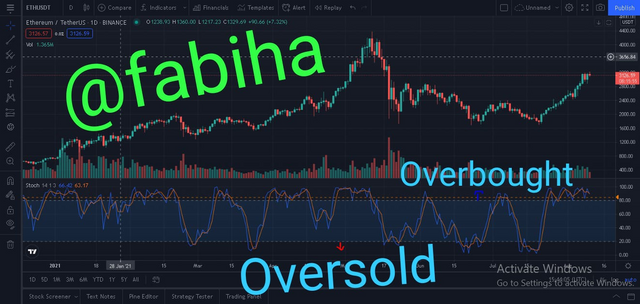
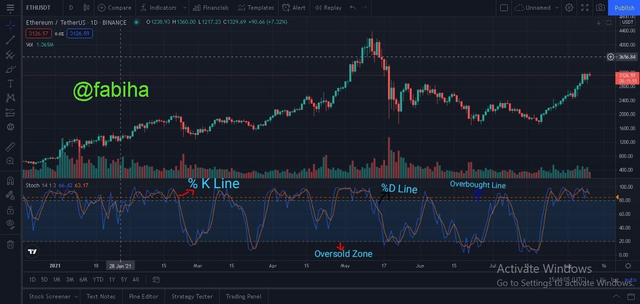
After Clicking on the Stochastic Oscillator we have a Stochastic Oscillator in our chart as shown in the picture we have successfully add a Stochastic oscillator.
As Shown in the Picture Above the %k line is the blue line while the %D line is the brown line. the overbought zone starts from 80 to 100, while The oversold region or zone starts from 20 downward.
**
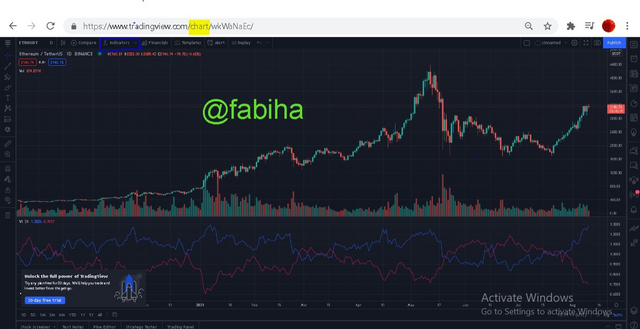
To Add Parabolic Sar Again I Visit TradingView.com Click on Chart than Indicator.
After clicking on the indicator here is the search option now, search Parabolic SAR
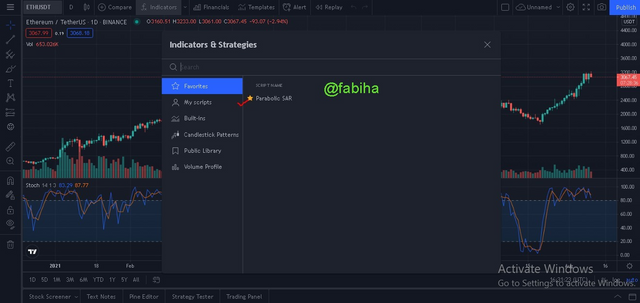
Now, click on Parabolic SAR after clicking on Parabolic SAR here is a added chart lets see in the picture.
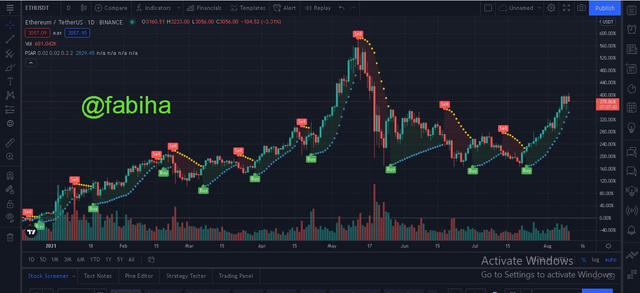
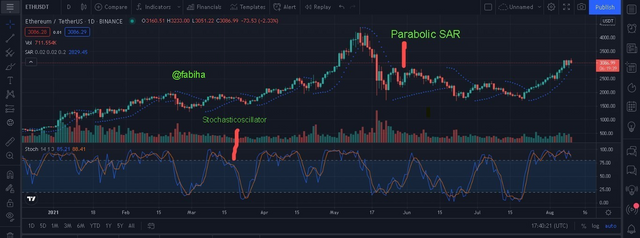
I have Added both indicator Stochastic oscillator and Parabolic SAR as Shown in the picture
 tradingView.com
Here I've chosen to replicate an exchange passage point as per the two indicators. In reality, we should discover a point that the "%K" line crosses the "%D" line and goes up in the Stochastic Oscillator and the specked line ought to be begun to show underneath the market cost. Then, at that point, we can enter the exchange as the market value makes an uptrend.
Above we can see when we get the right sign from the two indicators, we can get an exact sign and a higher chance to expand our benefits.
To obtain various additional information, you can visit the following sites:
https://www.investopedia.com/articles/technical/073001.asp
https://medium.com/@netpicks/how-is-the-parabolic-sar-indicator-used-effectively-in-trading-6749562f476a
END OF HOMEWORK
Finally, I will be thankful to the professor for his grateful explanation in the homework I will try my best to explain Hopefully get a good result again thanks to professor @lenonmc21
Regards,
CC, @lenonmc21
Hello @fabiha,
Thank you for taking interest in this class. Your grades are as follows:
Feedback and Suggestions
Your work is disorganized and difficult to understand. Some examples are unclear and without illustrations to back them up.
Please always take time to understand the topic before you attempt the tasks.
Your trade simulation in the last question is unclear.
You should also work on your overall presentation.
Thanks again as we anticipate your participation in the next class.