Crypto Academy / Season 3 / Week 8 - Intermediate: Crypto Assets and the Random Index (KDJ)
Hello everyone. This is my assignment post for professor @asaj in the last week of CryptoAcademy Season 3.
- In your own words define the random index and explain how it is calculated
Random Index
KDJ indicator is also known as a random index. It is a type of Technical indicator which determines the trend of an asset and gives entry and exit points.
This indicator Shows us over-bought and over-sold regions. When the lines are above 80% then it is said to be an Over-Bought region and when the line is above 20 % then it is said to be OverSold. However, some traders use between 75 - 100 for overbought Region and some traders use between 0-30 for oversold. It also tells us the current trend of the market. When the indicator is in an overbought region then it is a good sign to start looking for a sell signal. When the indicator is entering into the oversold region which is from 20% year down then it looks for buying opportunity.
It consists of three lines namely the %K line, %D, and %J line. The %J line measures the convergence and divergence of the K and D Line, The two lines i.e % K line and % D line are similar lines of the Stochastic oscillator. KDJ Indicator gives a Fast market signal when the Trend is clear. It also gives a great trading signal when the price of an asset is overbought or oversold.
Calculation Of RDX Indicator
For the KDJ Indicator, we have to first calculate the formula for calculating RSV is
N-day RSV = (CN - LN)/ (HN - LN) x 100
Where,
CN = Closing price in n days
HN = Highest price in n days
LN = Lowest price in n days
The three lines are calculated as below:
K-Line:
K value of the day = 2 / 3 × K value of the previous day + 1 / 3 × RSV of the day
D line
D value of the day = 2 / 3 × D value of the previous day + 1 / 3 × K value of the day
If there is no K value and D value of the previous day, 50 can be used to replace it.
J line
J value = 3 * k value of the day - 2 * D value of the day

2)Is the random index reliable? Explain
To start with, according to an overall point of view, no technical indicator is 100% Reliable. The reliability of any indicator relies upon the trader and his exchanging choices. As I Said that Also random index is not 100 % Reliable But it is Reliable to a large extent. It Acts for three lines K-Line, J Line, and D line, and these Three Lines show a trader both Buying and Selling: Points. The %J line measures the convergence and divergence of the K and D Line. As we know it is getting from the Stochastic Indicator. which determines the trend of an asset and gives entry and exit points it gives false signals in flat markets.

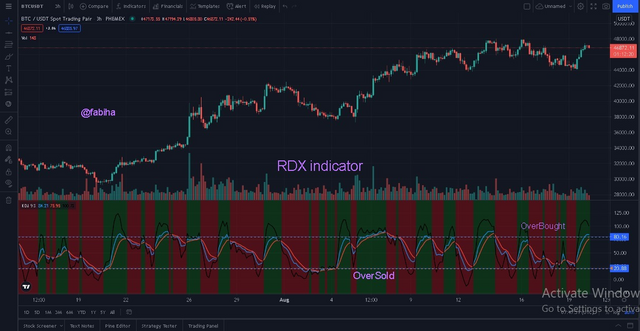
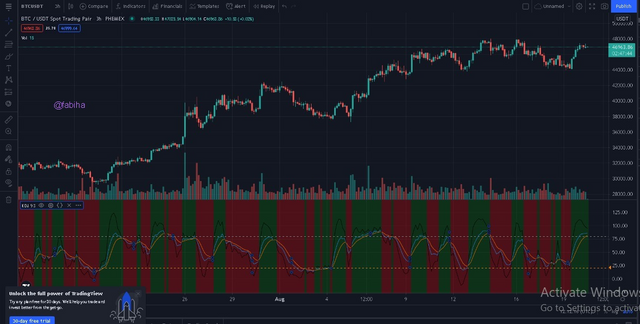
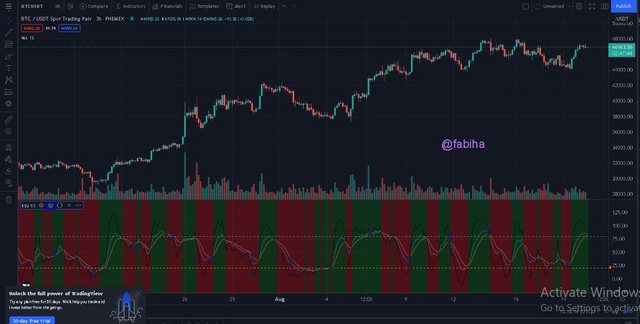
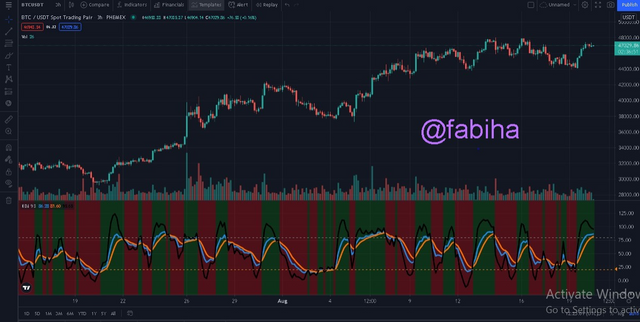
As Show in The picture, There is an orange line that is slower moving, Blueline is faster moving, and then we have the black line in which there is an extra j line and that j line is going to be our kind of overbought and oversold indicator. also, there is a presence of Green and red background which represents uptrend and Downtrend in the market by indicator also, Buyi8ng and Selling Signals. Shortly, When KDJ is used on a ranging or flat market, it is not Reliable but when it is used for an asset with a clear trend, the market signal is Fast and it is much reliable.
How is the random index added to a chart and what are the recommended parameters? (Screenshot required)
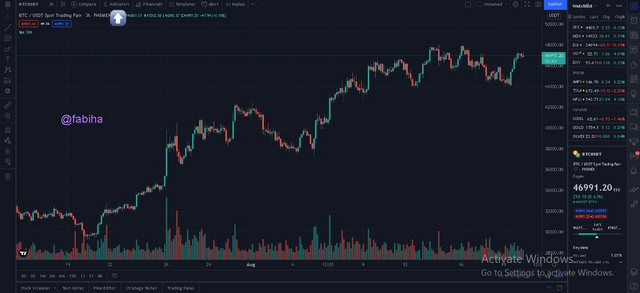
To Add the KDJ indicator I will visit TradingView.Com

Here click on Chart After Clicking on Chart the New tab opens.
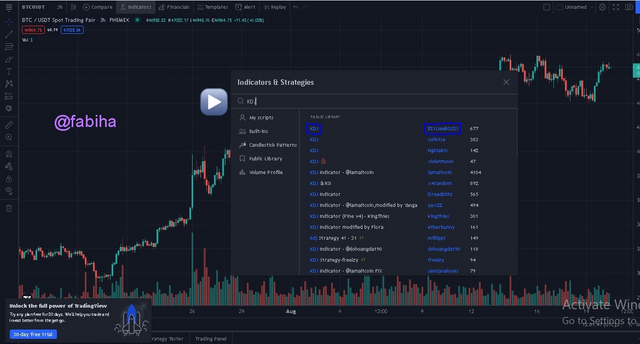
Here you Should Click on Fx indicators.
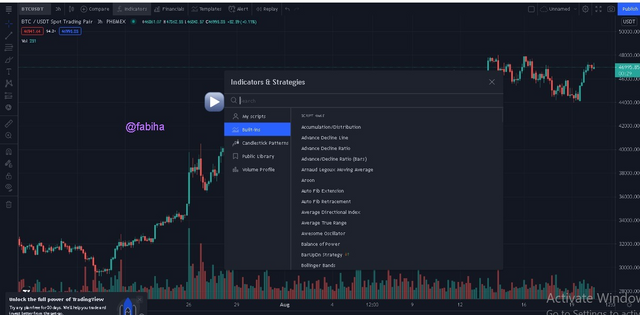
Here Search KDJ then as Shown in the picture click on the First indicator this is our main indicator.
So As Shown in the picture we have Successfully Add our indicator.
As we see the color is light So Here Click on the setting button.
Then Click on style than plot
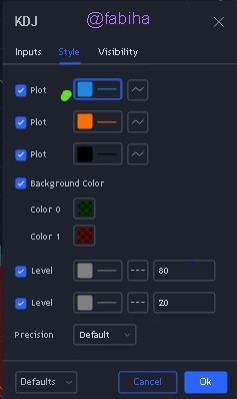
I will be the point as a blue line then click here
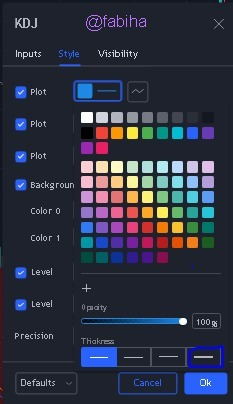
Then all the lines will be perfectly shown.
The recommended parameter according to Prof. @asaj, is a modified KDJ indicator by the user 1121LAMBOS21 on the trading view platform. He recommended his modified KDJ indicator because the trader is a pro user and skilled in the use of the KDJ indicator. His modified KDJ indicator has a period of 9 and a signal is 3.
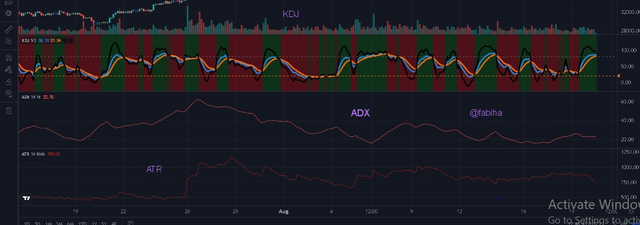
4)Differences between KDJ, ADX, and ATR
| KDJ | ADX | ATR |
|---|---|---|
| KDJ indicator is Commonly Known as The random index. | ADX is commonly known as the Average Directional Index. | ATR is commonly known as Average True Range. |
| It is a type of Technical indicator which determines the trend of an asset and gives entry and exit points. | It can be used to help measure the overall strength of a trend. | It is used to determine the movement of stocks or financial assets on the market with regard to their volatility. |
| It represented three lines in the Graph. | It represented a single line in the Graph. | It also Represented a Single Line in the graph. |
A Chart to Show lines.
5)Use the signals of the random index to buy and sell any two cryptocurrencies. (Screenshot required)
I will Choose BTC/USDT
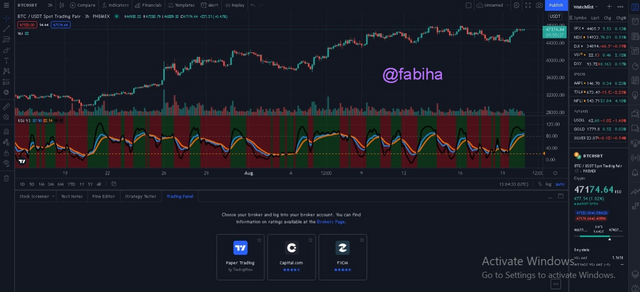
Here I will click on the paper trading then connect then purchase
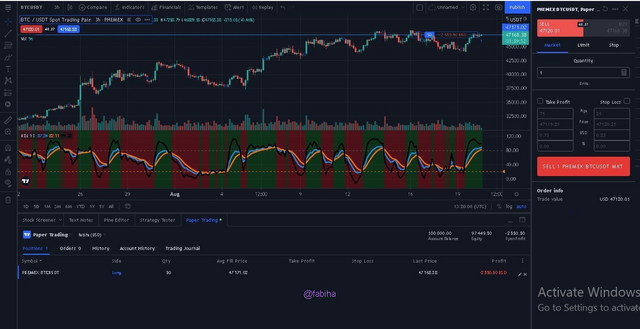
After purchasing Order After Some time I Will get a profit of USD then I sell it.

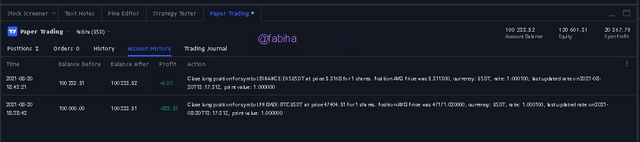
2nd I will choose EOS/USDT
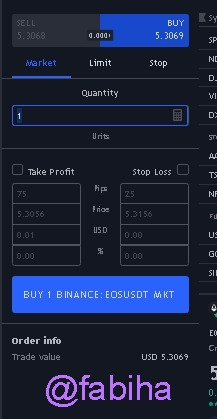
At EOS/USDT I will Close my order at 0.01 Profit.
Conclusion
Thank you professor @asaj for this informative and insightful lesson.
Respected mention
Regards,
Congratulations, your post has been upvoted by @Scilwa, which is the curating account for @R2cornell's Discord Community.
Hi @fabiha, thanks for performing the above task the eighth week of Steemit Crypto Academy Season 3. The time and effort put into this work is appreciated. Hence, you have scored 5 out of 10. Here are the details:
Remarks
You have demonstrated a good understanding of the topic. You have performed the assigned task excellently. However, your answer to task 5 could have been better if you had analysed two coins with clears charts providing the buy and sell signals as well as a screenshot of your demo account summary. Also, you did not provide the level of details we look out for in the academy.