Trading Using Wedge Pattern - Cryto Academy / S5W5 - Homework Post For @sachin08


INTRODUCTION
Good morning crypto family.
Season five have been great so far in crypto academy. This week being the fifth week of the fifth season, I, @ezege11 is glad to participate in the teaching of prof. @sachin08 on the topic Trading Using Wedge Pattern.
In this blog, I will in details perform the given task. Hope you'll find it interesting.😄
QUESTION 1
Explain Wedge Pattern in your own word.
Wedge pattern is a price pattern which uses convergence in price movement to determine the next market movement by bringing resistance and support lines together.
This pattern connects significant highs and lows over 5 to 30 periods which can be bearish or bullish giving the form of a wedge as both the resistance and the support line moves to meet each other at the point of convergence.
The simple wedge pattern is done by drawing the resistance and support lines on the chart to the point they cut across each other.
Wedge as a pattern can be bearish (downtrend) or bullish (uptrend) which occurs whenever a convergence trend line is seen, a reduction in volume as a result of price movement and finally a breakout from the trendline.
Wedge pattern just like a triangle pattern shows a pause in the market, either in a downtrend or in an uptrend.
There are two types of wedge
i. The rising wedge
ii. The falling wedge
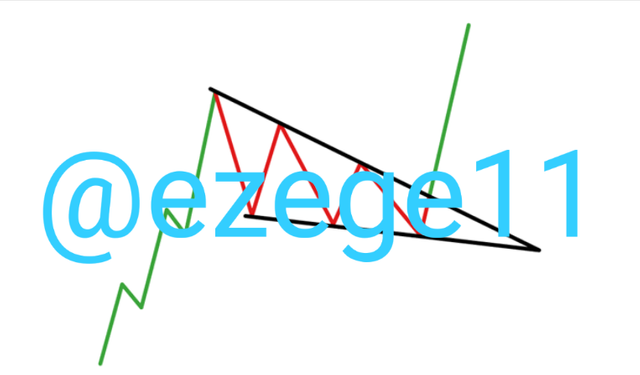
bearish wedge
Source
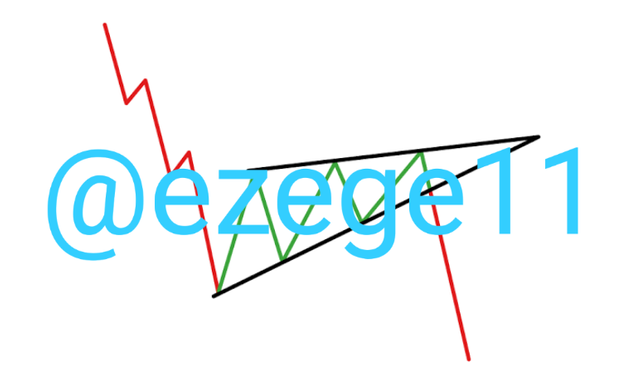
bullish wedge
Source
I'll do justice to the types of wedge in the next question.
QUESTION 2
Explain both types of wedges and how to identify them in detail (screenshots required).
Here, I'll be talking about the two types of wedge viz;
i. Rising wedge
ii. Falling wedge.
Rising wedge
This type of wedge signifies a bearish trend which is always accompanied by a bearish breakout. The large side of the trendlines that form this wedge starts below and narrows to the point of convergence on the upside before the downward breakout.
Rising wedge pattern forms at the top of a bullish market to signify a continuation of the bearish trend after a trend slowdown.
From the above screenshot, we can see the trend movement between the support and the resistance lines plunging upwards where the cross each other.
The support and resistance tested at least two points each before the breakout. We can also see the reduction in the trading volume as the wedge forms progressively.
Note that when a wedge forms in an uptrend ,it signifies a reversal.
Ways To Identify A Rising Wedge
For easy identification of a rising wedge there are few things to look out for which includes;
Wedge direction: the two lines of support and resistance must be directed upwards (upward plunge).
Support and resistance: drawing the support and resistance lines should be the first thing to do when identifying a rising wedge.
These lines should be in contact with at least two or three minor lows and highs respectively.Trading volume: the trading volume is meant to progressively reduce to form a rising wedge pattern.
There is also a light or heavy breakout, which mostly occur below average.
With the above guideline and a confirmed breakout, a trader can successfully set up a trade.
It is advisable to use an indicator to confirm the pattern before placing a trade
Falling Wedge
This is a type of wedge that forms in a bullish trend.
Here, the resistance and support lines converge downwards and from there, there is an upward breakout . And it signifies a rapid upward movement after a slowdown in trend.
The trend lines of support and resistance connects at least two points of lows and highs respectively.
Whenever this pattern forms and price rally upwards, it shows acontinuation pattern of an uptrend. While on the other hand, when the price goes down after the formation of this wedge it shows a reversal pattern.
From the above screenshot, we can see that after the wedge, a bullish rally set in and this is a continuation pattern
The trend lines (support and resistance line) converge at the downside. After few touches the price broke the resistance line and a bullish continuation sets in.
Ways To Identify A Falling Wedge Pattern.
Important tips in identifying a falling wedge are;
Trend identification: the market trend should be the first thing to know. Most times falling wedge forms after a bullish leg. Although it can be seen at extremely low area of a downtrend denoting a reversal pattern.
Identify the support and resistance lines:
The resistance and support lines are the lines that connects the minor lows and minor highs, and for a resistance and support line to be valid, they must connect at least two or three minor lows or minor highs respectively.The Trading Volume: as the convergence progresses in a falling wedge pattern, the volume should be reducing. And the breakout volume can either be heavy or light. Although, sometimes it appears to be average.
With the above guidelines, a successful wedge pattern can be carried out on the falling side.
I'll advice every trader to make sure they use indicators to confirm any pattern they see in charts.
QUESTION 3
Do the breakout of these wedge patterns Produce False Signals Sometimes? If Yes, Then explain how to filter out these false signals.
Yes, breakout of wedge patterns produce false signals although not always.
There have not been any pattern that proved to be 100% accurate. Therefore we can use indicators to confirm if a breakout is false or true.
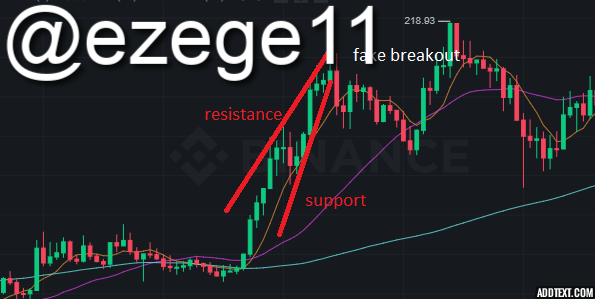
Sol/usdt pair source
In the above screenshot, we can see a fake breakout and a to the bearish direction and a sudden draw back into the wedge consolidation area.
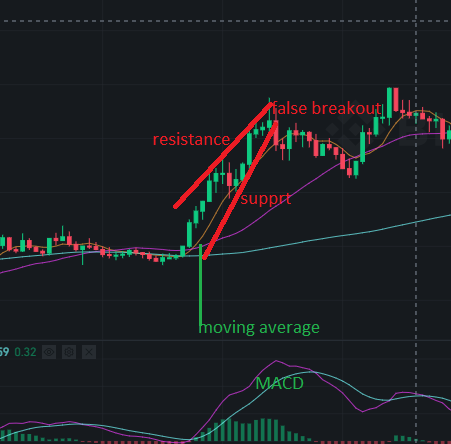
In order to to filter out the false wedge, traders are obliged to use indicators which proves a trend. I will be using the moving average indicator together with the MACD indicator
The MACD indicator
This indicator when well set helps the trader to know the exact point a price action crosses from bullish to bearish and vice versa.
In a bearish breakout the MACD indicator simply crosses to the bearish side.
Moving average
This indicator moves with the market price and whenever the moving average cuts price and start trading above price, the market turns bearish.
QUESTION 4
Show full trade setup using this pattern for both types of wedges. (Entry point, take profit, stop loss breakout)
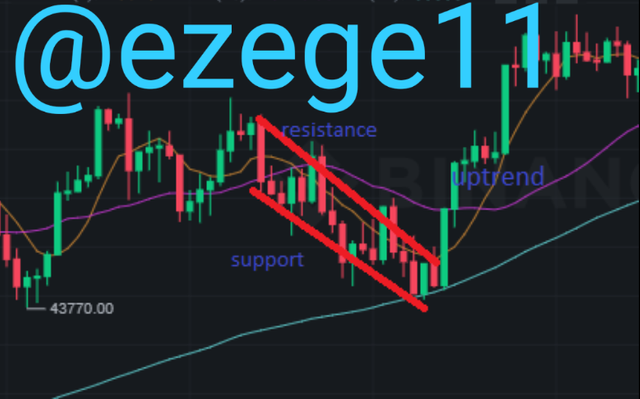
Trade setup using falling wedge
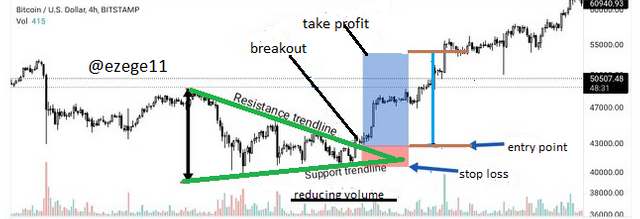
In the above chart, I first drew the support and resistance line which gave me a hint of the market trend. I also checked for a progressive decrease in volume and at the break point of the resistance trendline, I made my entry into the trade. Placing my stop loss below my entry point and my take profit way above my entry point.
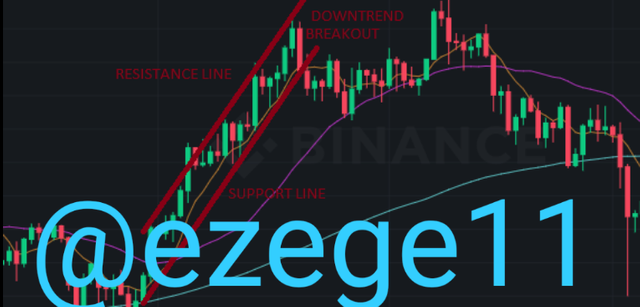
Trade Setup Using Rising Wedge.
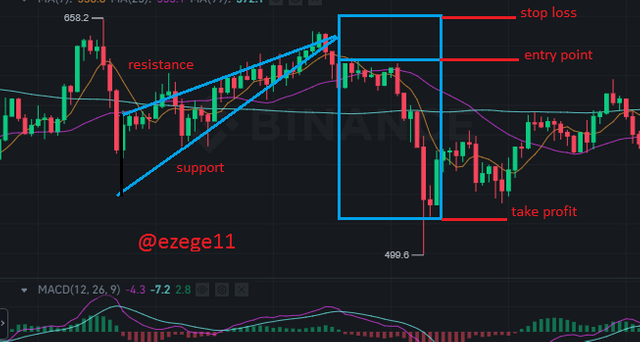
The above screenshot is a setup of my entry into the bnb/usdt market on binance using the rising wedge pattern.
I followed the procedures I listed earlier and I made a good entry.
CONCLUSION
Concluding, I'll say patterns are very important to a trader in that they help the trader to make good trades.
The wedge pattern have two types which are the rising and the falling wedge patterns.
Making use of this strategy along side indicators the trader is bound to make perfect trades and help them maximize profit.
I appreciate prof. @sachin08 for this lesson and i must say thank you to all my readers.
Remain bless