Steemit Crypto Academy Season 4 Beginers' Course -Homework Post For Task 10: Candlestick Patterns.
Homework
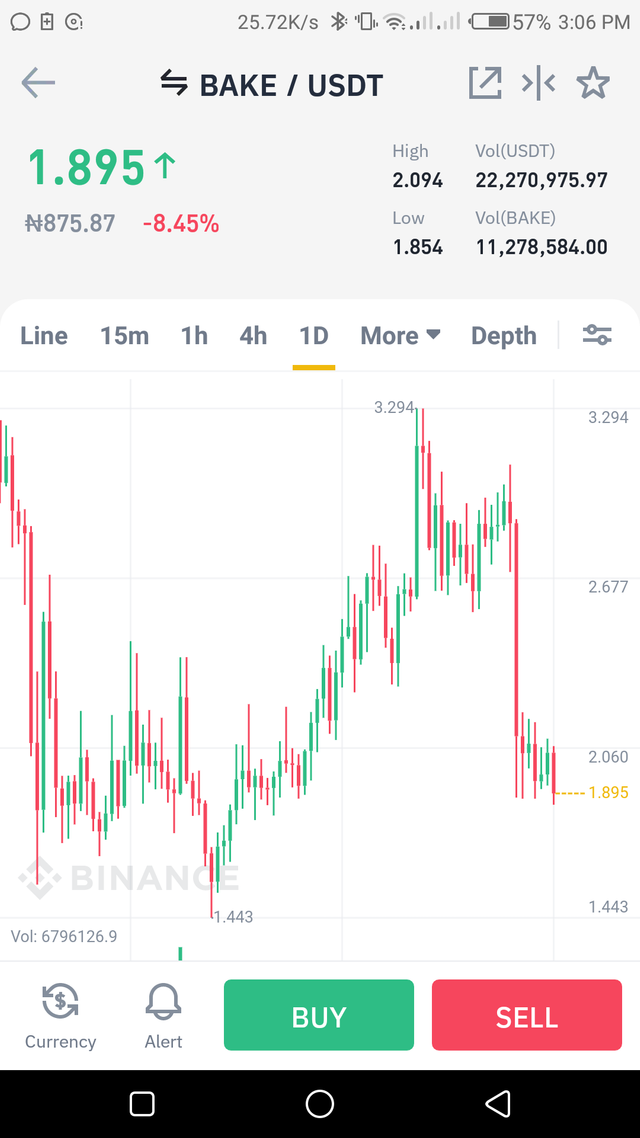
- Explain Japanese candlestick chart? (Orginal screenshot required). In your own words, explain why the Japanese candlestick chart is the most used in the financial market.
Describe a bullish and a bearish candle. Also, explain the anatomy. (Original screenshot required)
The Japanese Candlestick Chart.
The japanese candlestick chart was developed by a Japanese rice trader (Munehisa Homma) in the 1700s.
Homma's discovery was based solely on the emotions of rice traders. Nowadays in stock analysis, Japanese candlestick is used to determine change in price and market reaction to this.
The exchange between buyers and sellers on a particular asset formed the Japanese Candlestick.
The usefulness of this candlestick is that it shows major price difference at each point and preceding analysis of change in price.
Why Japanese Candlestick is the most used in the Financial Market.
For the fact that the Japanese candlestick always provides an exact and specific chart to represent changes in price, and also showing points of interactions between buyers and sellers gave it edge over other candlesticks charts and made it the most used in the financial market.
The Japanese candlestick chart gives detailed graphics on the determinants of price deviation which are: demand and supply.
Bullish candle
As the name implies, bullish candle is a candlestick pattern that forms in a downtrend and brings about reversal and causes an uptrend.
It indicates that buyers have taken over the market, or that buyers are stronger than the sellers in the market.
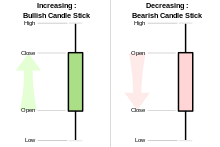
Anatomy of the bullish candlestick
A normal candlestick has four parts: Open, Close, High, Low each symbolizing distinctive point in price motion.
- Open (opening price) - the opening price of a candle betokens the start of price motion. This point is spotted and taken note of.
- Close (close price )- the closing price of a candle shows the end of the candle within a stipulated time indicating the past price taken note of.
- High (highest price)- this is the part of the candlestick that shows the highest price registered in a given time.
- Low (lowest price)- the part of the candlestick that shows the least price taken note of per time.
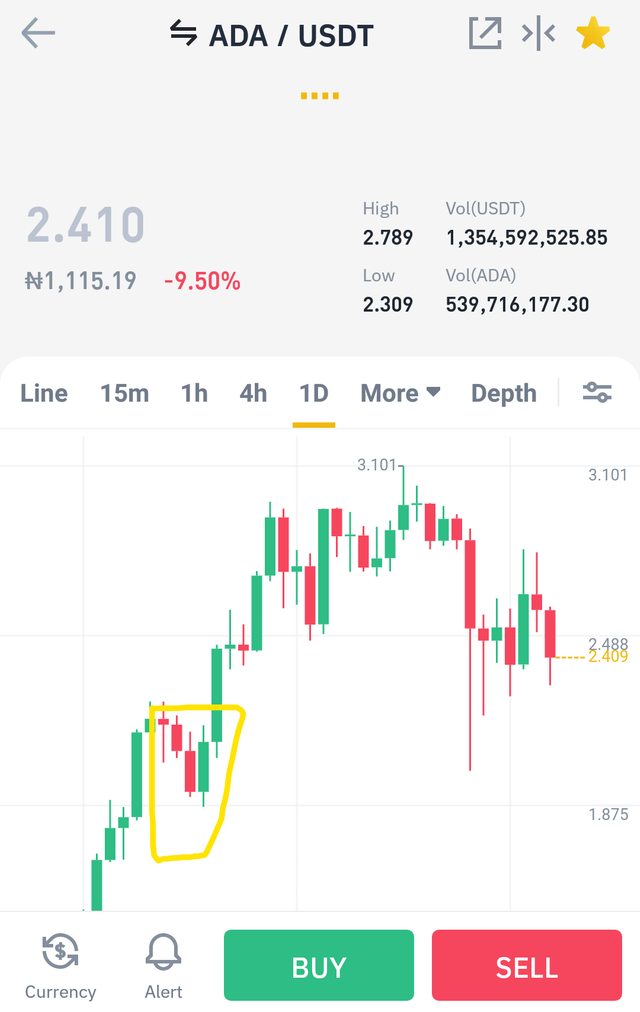
The bullish candle opens below and closes above. The bullish candle appears as a green or a white candle and inundates the previous red candle.
The chart above shows a bullish candle engulfing a red candle, this portrays that buyers are in control of the market.
Bearish candle
A bearish candle is a reversal candle that prints in an uptrend and changes the market. It denotes that the sellers have taken over the market and buyers are no longer in control of the market.
Anatomy
Referencing the previous gross anatomy of candlestick:
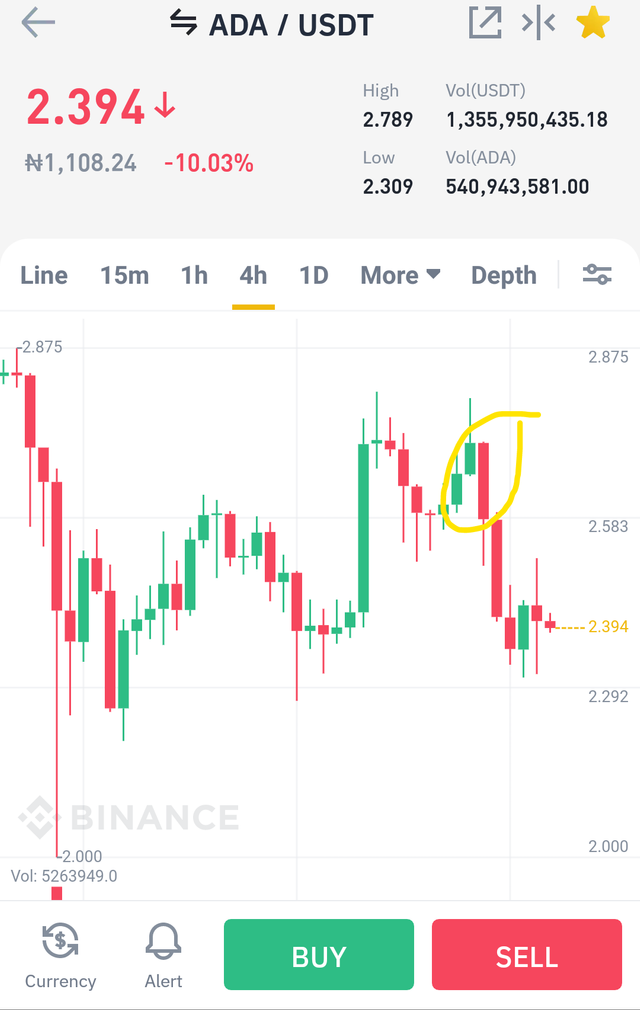
The length of the bearish candle engulfs the previous green candle. It opens above and closes below.
The picture below shows what a bearish candle look like in chart;
From the chart above it can be denoted that the bearish candle is longer than the previous green candle and it changed the market direction.
Conclusion
I appreciate you prof. For making me understand the Japanese candlestick chart.
And now i can distinguish between a bullish and a bearish candlestick chart.


.png)

