Reading Special Bar Combinations - Steemit Crypto Academy - S5W8 - Homework Post for @sachin08

Compliment of the season my fellow steemians,
I must say that it have really been a journey of great learning. From the first week to this final week of this season 5 of crypto academy.
we have been privileged to learn from different professors, different ways that the crypto ecosystem works and how we can make profit from the trades we involve ourselves in. This week, being the final week its a pleasure to learn from professor @sachin08 who discussed a very vital subject titled "Reading Special Bar Combinations.
Without wasting much time I'll like to do justice to the given task.

Question 1
Explain Price Bars in your own words. How to add these price bars on Chart with proper screenshots?
Price bar is an analytical tool, used by traders to make accurate prediction of an asset's price movement within a given period. Some features of price bar are vital in the sense that it assist the trader to make better trading decision. All price bar is consist of vertical and horizontal lines.
As stated above, two basic lines make up the price bar viz;
- The vertical and
- The horizontal lines.
It is important to mention here that in the price bar, we have two different horizontal line present on the price chart when looking at one candlestick. The two alternate lines are the open and the close lines respectively. The colour of the price bar determines the position of these lines.(Price bar can be red or green).
For a green bar, the open is located on the left hand side of the vertical line close to the trough of the line known as the low. That is to say, the trough of the price bar is called LOW, on the same note, the close is located at the right hand side of the vertical line close to the crest of the line also known as the high. Which means, the top of the price bar is the HIGH.
For a red price bar, the open is located on the left hand side of the vertical line near the top of the line known as the high. Instigating that the top of the price bar is called HIGH, in the same vein, on the right hand of the vertical line you'll see the close. The point is also called the low.
A trader can make profitable trading decision and also technical analysis with the open, close, low and high information provided by the price bar on a given chart.
The provided information helps traders to know when to enter or exit a trade. Price bar are usually of green color when spotted on an uptrend indicating a buy signal when more green appears on the given chart. In the same way, and when the chart shows a downtrend, the price bar is red in colour signalling a sell and with more red price bar a sell order is confirmed.
How to add a price bars on Chart
There are simple steps you can follow in order to add price bar on a chart they include:
Step 1: open tradingview.com and go to the chart interface.
On the chart interface click on the candlestick logo.

Step 2: from the list of the dropped down options select bar.

And below is what your chart will look like

To further explain the open, high, close and low I'll be using one bullish bar and one bearish bar.

Source and edited by me using text2photo.com
Description of some terms
Open: this is where a price bar commences.
High: this the highest vertical point a price of an asset can reach in a particular price bar.
Close: this is the point where the price of an asset in a given price bar ends.
Low: this is the lowest vertical point a price action can reach on a price bar.
Question 2
How to identify trends using Price Bars. Explain for both trend. (Screenshots required)
Identification of trend using price bar is no different from other tools.
In an uptrend
To identify an uptrend using price bar, we have to look out for higher highs and higher lows as shown in the screenshot below;
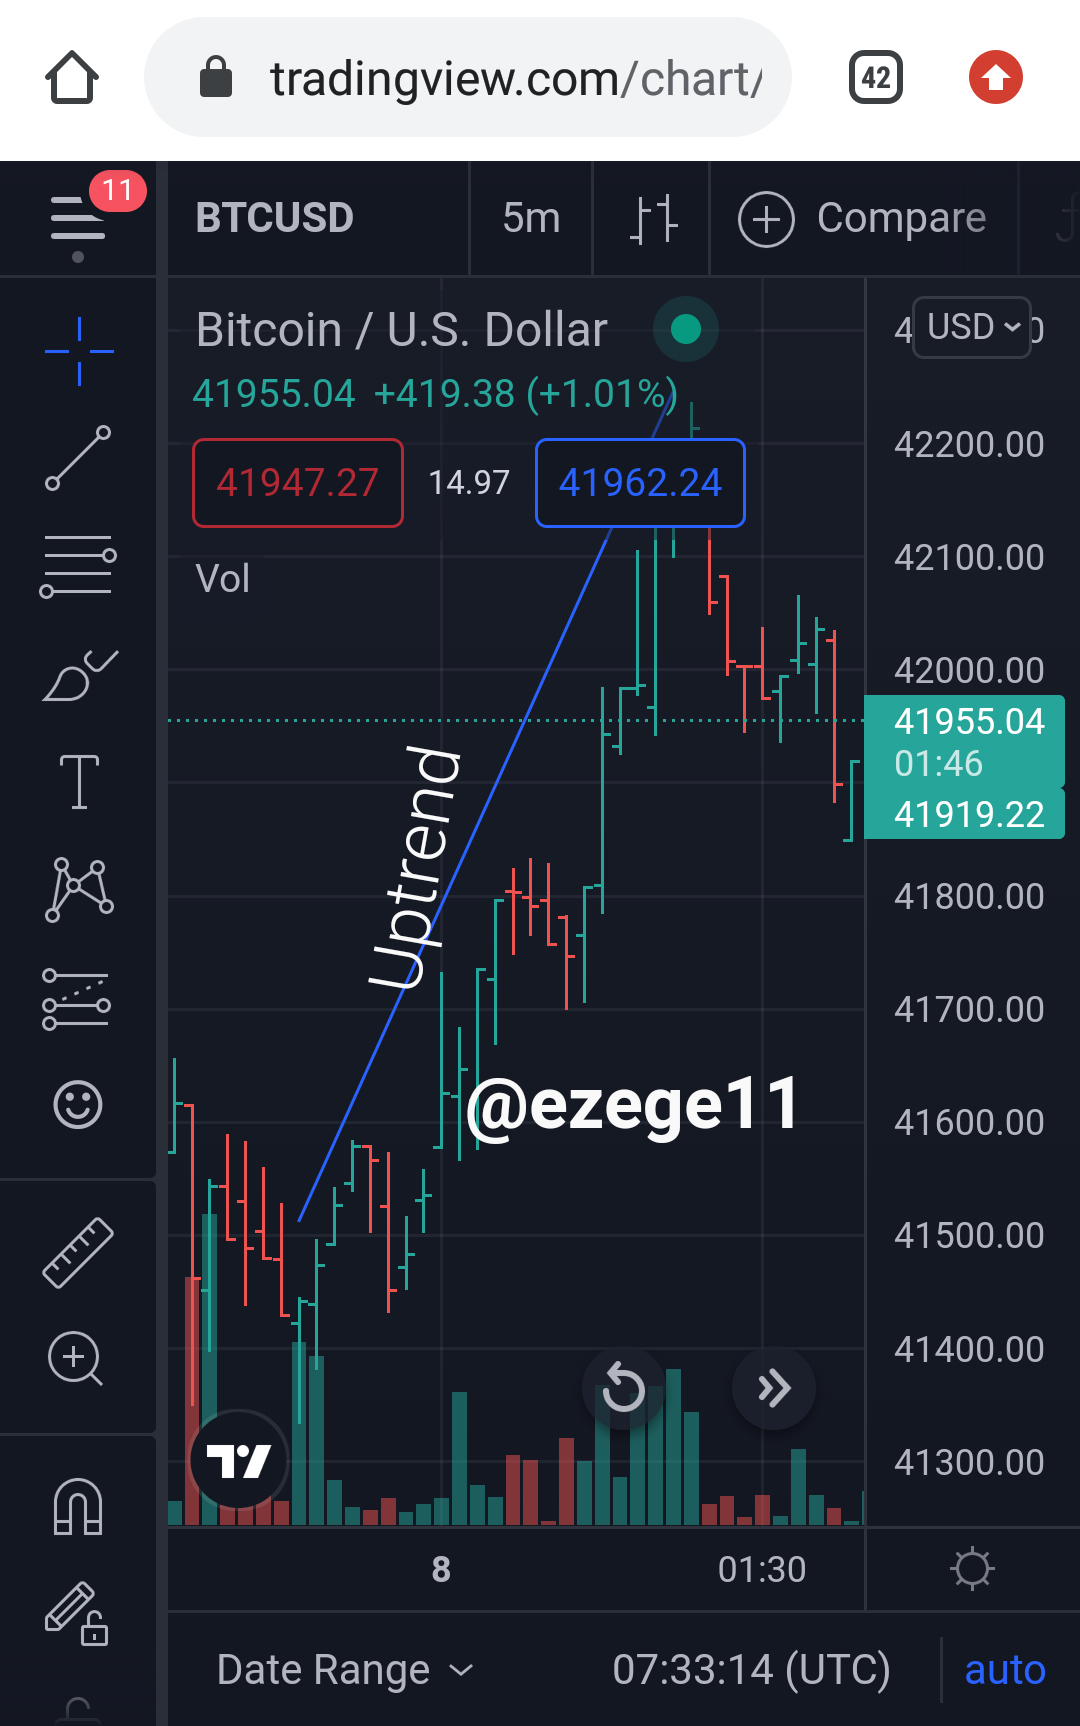
In an uptrend, the price action is seen moving upwards and this is where traders buy and wait for a reversal point where they sell off and take profit.
Identifying a downtrend
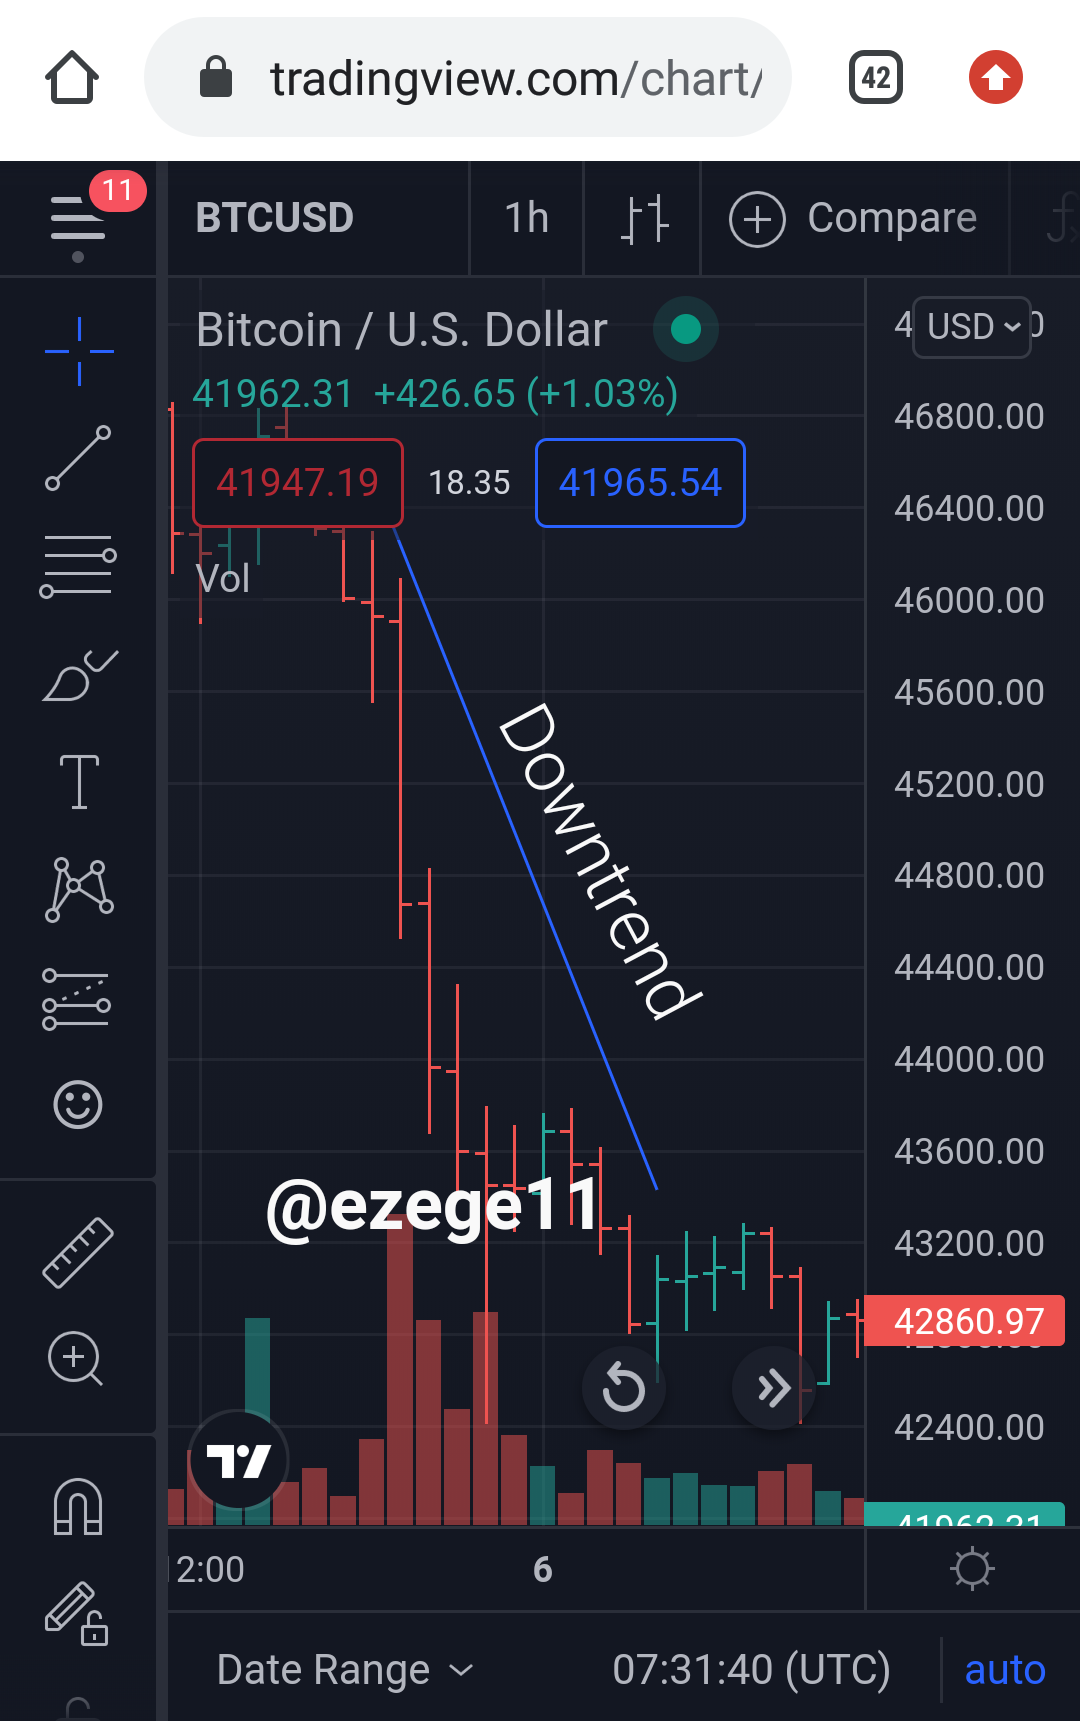
For downtrend identification, we look out for series of lower highs and lower lows with the price action moving downwards. Traders sells off assets here and wait for a trend reversal so as to buy back.
A downtrend is shown in the picture below;
Question 3
Explain the Bar Combinations for Spending the Day inside for both conditions. (Screenshots required)
Price bar, like every other tool used in the price chart analysis, has its own unique pattern which it uses to signal or give the trader information about the price chart.
Here, I will be talking about these patterns, specifically the price bar combination for Spending the Day inside.
This condition, pattern or combination is seen when the current price bar for the day is engulfed inside the previous bar for the day before. Simply put, the new price bar's high and low are engulfed totally by the older price bar of the day before. This pattern is displayed by the formation of price bars, it indicates a state of uncertainty in the price market of an asset. Market uncertainty here means the level of demand and supply in the market is almost at the same point or equal. For this reason, the holders of assets are not willing to sell and the potential buyers are eager to buy.
This signal portrayed by this combination is unsure, it doesn't predict price breakout and trend reversals, it just uncertainty. A set up where price movement is uncertain. And it can occur either in an uptrend or a downtrend.
For Spending the Day inside to form successfully on a price bar there are certain conditions that must be met.
- Firstly, the former price bars high must be at a higher point than that of the current or new one.
- Secondly, the older price bar must be lower than that of the new price bar.
Below is a screenshot I used to describe the opening day inside combination for both bearish and bullish.
For a closing the day inside bearish price;

Talking about a bearish day inside we will notice that the open and close of the former bullish price bars covered the new bearish price bar. This combination signals a downtrend or trend reversal.
For a closing day inside a bullish price;

Source
When we talk about the bullish day inside, we can observe that the previous bearish price bar engulfs the following bullish price bar and this signals a bullish trend.
Question 4
Explain The Bar Combinations For Getting Outside For The Day For Both Conditions . (Screenshots required)
Getting outside for the day, usually occurs in two distinct ways, which are
i. Getting outside in a continues trend: here movement can be from bullish to bullish/bearish to Bearish.
ii. Getting outside for a day from trend reversal: here it can be from bullish to Bearish or bearish to bullish.
This movement occurs when both the open and close candle is seen outside the day bar also both the highs and the lows but in a particular range.
This ranges can occur in two different pattern, which are;
i. An uptrend scenario, in a case of an open from both lows and close near the new high, which is higher than the previous high of the previous price bar
ii. A downtrend scenario, where there was an open from both highs and closes near the low, lower than the previous low of the former price bar.
Nevertheless, the criteria is the same for both case of bullish and bearish as they always signal a trend continuation or a trend reversal.
For a bullish scenario,
In this case the price bar signals an uptrend in the sense that we will be able to see that there was an open from the lows and the close was near the high although the close is usually higher than the previous price bar's high.

Source
Taking a close look at the bitcoin/USD chart above, we can see clearly that it's a bullish trend continuation because the candle was first showing an uptrend scenario, and thwre was a little ranging in market price tilting towards the bearish side but after the consolidation the bullish rally continued, although there was an open from both lows and close near the high which is higher than the previous price bar's high.
For a bearish scenario.
In this case,the bar usually signals that a downtrend because as we can see, there was an open from the highs and a close near the low and the close was lower than the previous price bar of the previous low.

Taking a good look at the bitcoin/USDT chart above, we can say that it's a trend reversal, from bullish to bearish. Because the candle was first showing a an uptrend where there was an open from the highs and close was near the low which is lower than the previous price bar of the previous Low and it continued in this same manner downtrend.
Question 5
Explain the Bar Combinations for Finding the close at the open for both conditions in each trend. (Screenshots required)
You can identify the bar combination for looking the close at open in two ways, which are;
i. For bullish movement
ii. For bearish movement
This scenario of close at open is seen when price of an asset occur by forming open and close almost simultaneously, when seen near the high, it signals a bullish trend and on the other hand, when it forms towards the low it signals a bearish trend
For a bullish scenario.

Looking at the above screenshot, We can clearly see that the chart signifies a trend reversal from bearish to bullish because we can see how the candlestick is forming higher highs with both Open and close near the high as seen in the screenshot above. A reversal only occurred here because both the open and the close are be seen near the low.
For a bearish scenario.

From the above screenshot, We can see that the chart signifies a trend reversal from bullish to bearish because we can see how the candlestick is forming Lower lows after the consolidation above with both Open and close seen near the low. A reversal only happen here because both the open and the close are be seen near the high.
Conclusion
Concluding, I'll start by appreciating the professor in the person of @sachin08 for this great teaching.
My appreciation also goes to my audience for always reading my post because without you guys i bet i wont be here.
And I'll conclude by saying, happy new year and happy reading. 😄