Crypto Academy / Season 3 / Week 7 – Homework Post for [professor @lenonmc21] Analysis and Trading with the indicators "Stochastic Oscillator +"Parabolic Sar"
.png)
Hello steemians, am glad once again to participate in this week’s lecture and homework task. I read through the lecture and have learnt a lot through it. Thanks Prof @lenonmc21 for this great lecture on Analysis and Trading with the indicators "Stochastic Oscillator +"Parabolic Sar". To this, I will be answering based on the professor’s task.
Theory (No images)
Define in your own words what is the Stochastic Oscillator?
Stochastic Oscillator is one of the vital technical indicator developed by George Lane in 1950 which investors uses to determine the particular current closing price to the high-low range over a period of time of an asset. This indicator ranges from 0 – 100 and thus can be by traders in indicating the overbought or oversold period of a certain asset in a period of time.
With the help of this indicator, traders will able to detect a good time to make entry or exit an order without loss. It is one of the indicator popularly used by traders to determine a possible bearish or bullish trend of an asset in the crypto market.
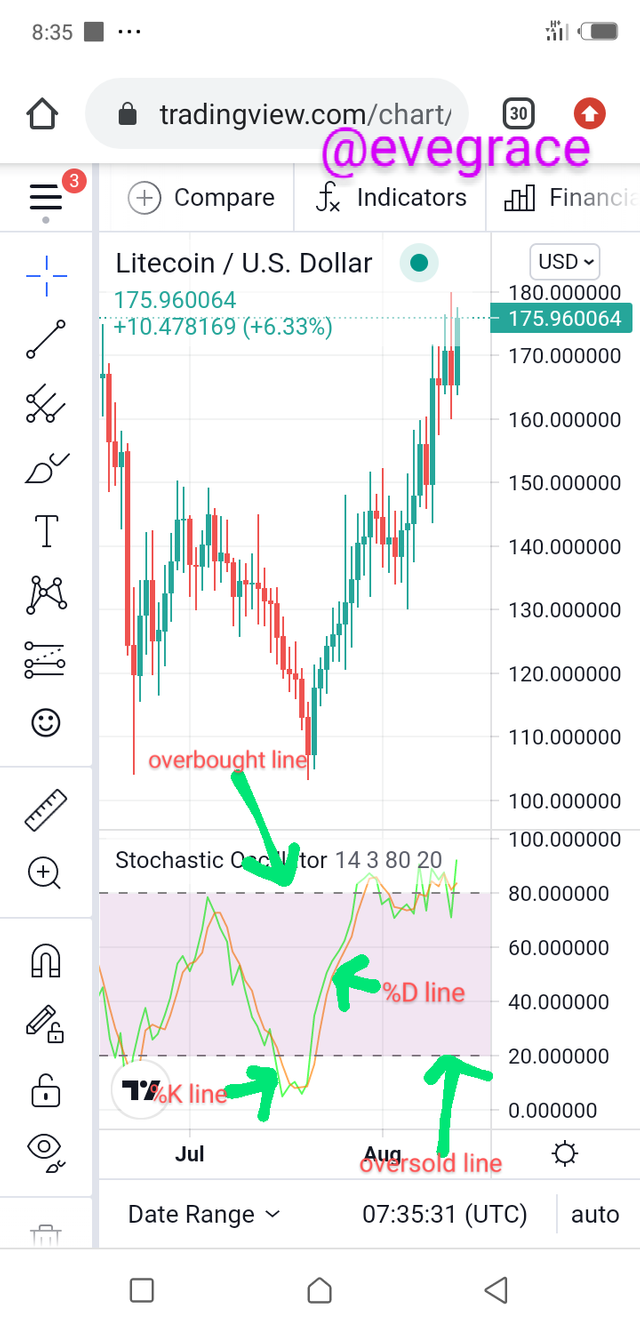
Explain and define all components of the Stochastic Oscillator (% k line, % D line + overbought and oversold limits).
%K line: The %K line is one of the component of Stochastic Oscillator which outlines the actual value of price movement of a particular asset. It is a line that enables a trader to trace the recent price of an asset in the market. Thus it can be calculated as:
%K = [(CCP – LPT) / (HPT – LPT)] x 100
Where %K = Stochastic line
CCP = Current Closing Price
LPT = Lowest Price Traded
HPT = Highest Price Traded
%D line: The %D line is also one of the component of Stochastic Oscillator which shows the simple moving average of the actual value of price movement. It is also called Stochastic slow because of its slow reaction to the price change in market.
Overbought limit: Overbought limit is the limit where the %K line and the Stochastic slow crosses above the 80 limit of the Stochastic Oscillator line. The overbought limit shows a possible reverse in the bullish trend of an asset.
Oversold limit: Oversold limit is the limit where the %K line and the Stochastic slow crosses below the 20 limit of the Stochastic Oscillator line. The oversold limit shows a possible reverse in the bearish trend of an asset.
Briefly describe at least 2 ways to use the Stochastic Oscillator in a trade.
The two ways in which Stochastic Oscillator can be used in a trade are:
Spotting entry and exit order:
The indicator can be used by traders to spot a good entry for a trade as well as a good exit position of an order for a particular asset. When the %K and %D lines crosses over the 80 limit stochastic line, it entails a possible reversal in the bullish trend thus this is a good time to exit an order so as to make profit. Also, when the %K and %D line crosses below the 20 limit stochastic line, it entails a possible reversal in the bearish trend thus this is a good time to open or make entry of an order so as to make profit in trading of the asset.
Forecasting a possible trend:
The indicator is also used by traders to forecast a possible trend may be bullish or bearish. In an uptrend, if the Stochastic slow line crosses over the %K line in the resistance zone, it indicates a possible change in the uptrend to a bearish in the trend movement but in a downtrend, the %K line crosses over the Stochastic slow, it indicates a possible change in the downtrend to a bearish trend.
Define in your own words what is Parabolic Sar?
Parabolic Sar is another technical indicator that was developed by J. Welles Wilder. The indicator is also known as stop and reverse indicator. It is an indicator that traders uses to identify the changes in trend direction of an asset as well as its price. The indicator makes use of dots which shows the direction to which an asset trend is moving and the possible trend reversal. This indicator helps traders to make a good decision towards the entry and exit of an order to make profit.
Explain in detail what the price must do for the Parabolic Sar to change from bullish to bearish direction and vice versa.
Parabolic Sar changing from bullish to bearish direction
As the bullish trend keeps moving high, the dotted Parabolic Sar lines moves under or below the market price. So as the dotted lines touches the bullish candlestick trend, it shows a possible reversal in the bullish to a bearish trend and this marks a good time for investors or traders to exit their order and sell off their asset to make profit.
Parabolic Sar changing from bearish to bullish direction
As the bearish trend keeps moving, the dotted Parabolic Sar lines moves above or over the market price. So as the dotted lines touches the bearish candlestick trend, it shows a possible reversal in the bearish to a bullish trend and this marks a good time for investors or traders to make entry of an order and buy up more asset to make profit in future.
Briefly describe at least 2 ways to use Parabolic Sar in a trade?
The two ways in which Parabolic Sar can be used in a trade are:
The indicator can be used by traders to spot a possible reversal trend. When the market price of the asset is in a bullish trend and the parabolic Sar indicator touches the bullish candlestick, there is always a possible reversal to be seen in the bullish trend and also when the market price of the asset is in a bearish trend and the parabolic Sar indicator touches the bearish candlestick, there is always a possible reversal to be seen in the bearish trend and this will help the trader to make a good decision on when to open a trade or close a trade without incurring loss.
Practice (Only Use your own images)
It shows a step by step on how to add the Stochastic Oscillator to the chart (Indicating the% k Line and the% D Line, the overbought and oversold zone.
For this task, I will adding the Stochastic Oscillator indicator to my chart.
First, you have to visit: https://www.tradingview.com/

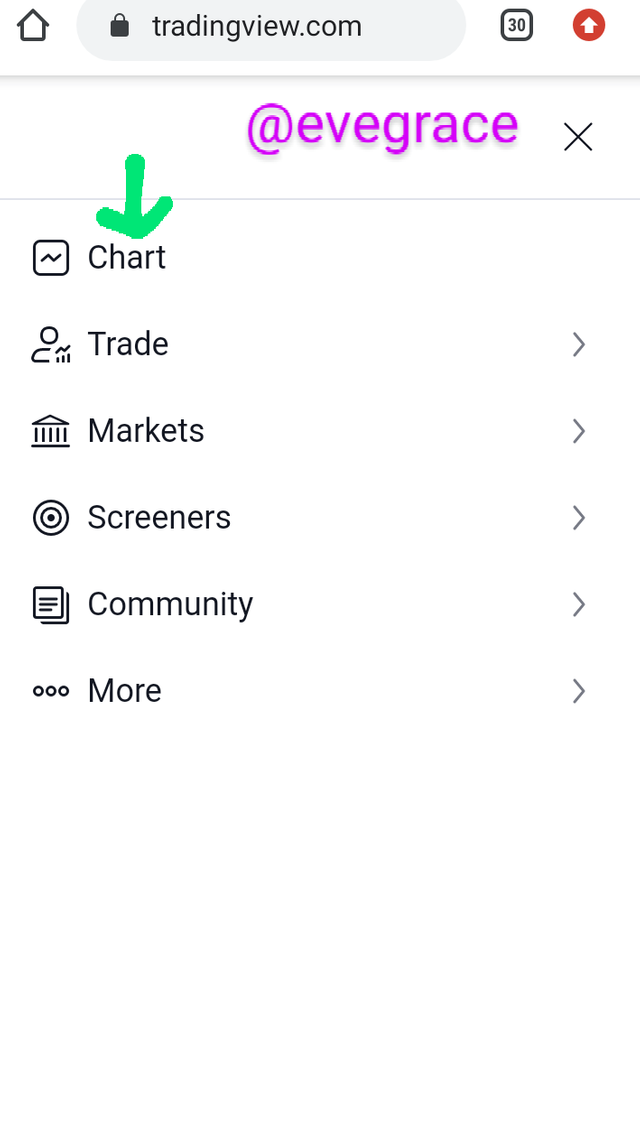
Then I clicked on the “Menu” bar at the top left corner of the opening page, this took me to a new page where I clicked on the “Chart” option
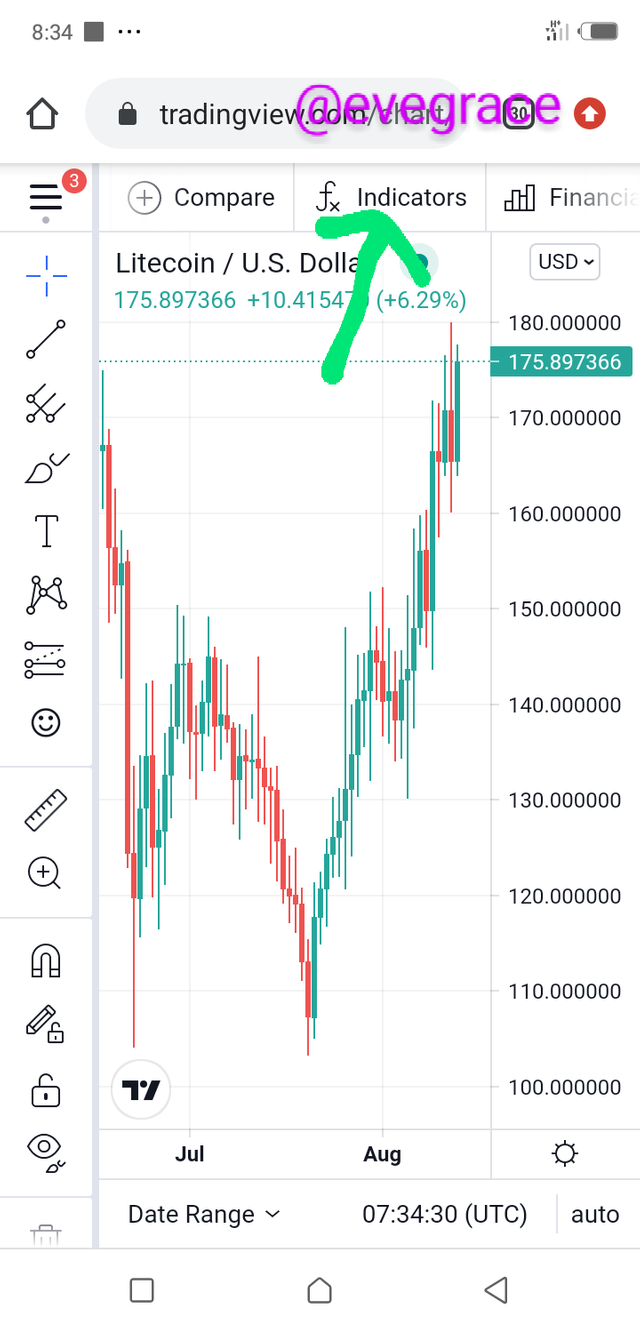
After clicking on the chart option, it redirected me to the charting interface where I now clicked on the “indicator” icon at the top corner of the page.
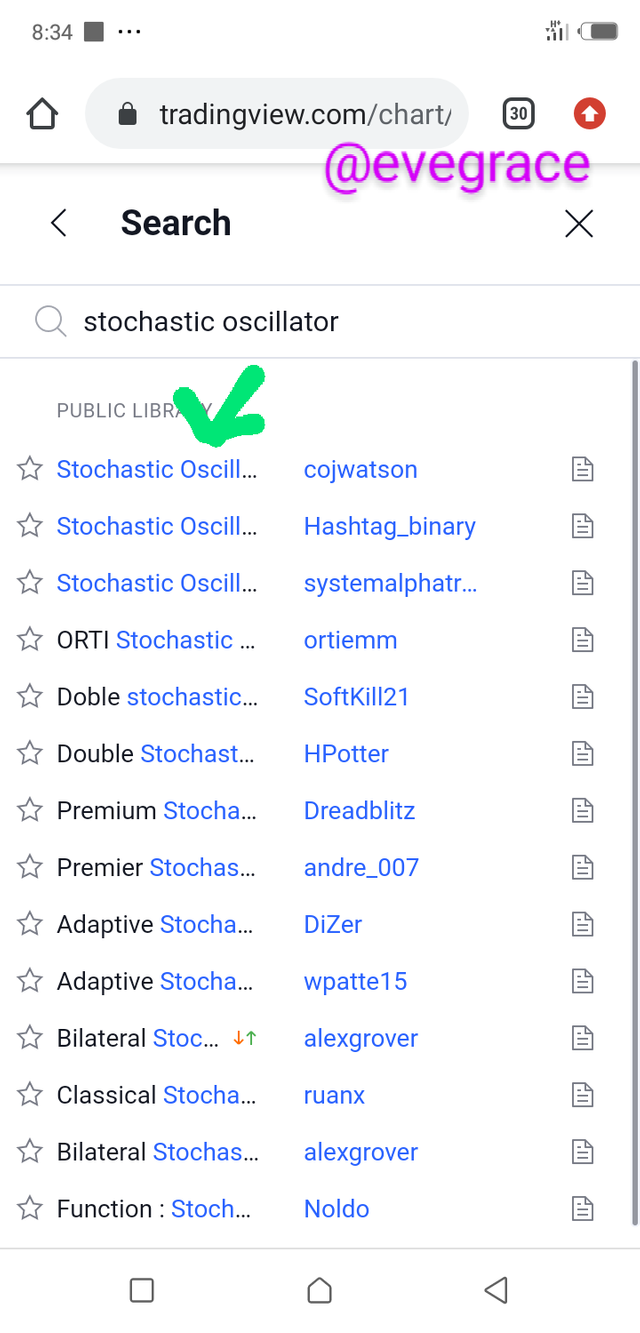
After clicking the indicator icon, a pop out window showed where I then searched for the Stochastic Oscillator indicator and it displayed, then I clicked on it and it was added to the chart as shown below.
Show step by step how to add Parabolic Sar to the chart and how it looks in an uptrend and in a downtrend.
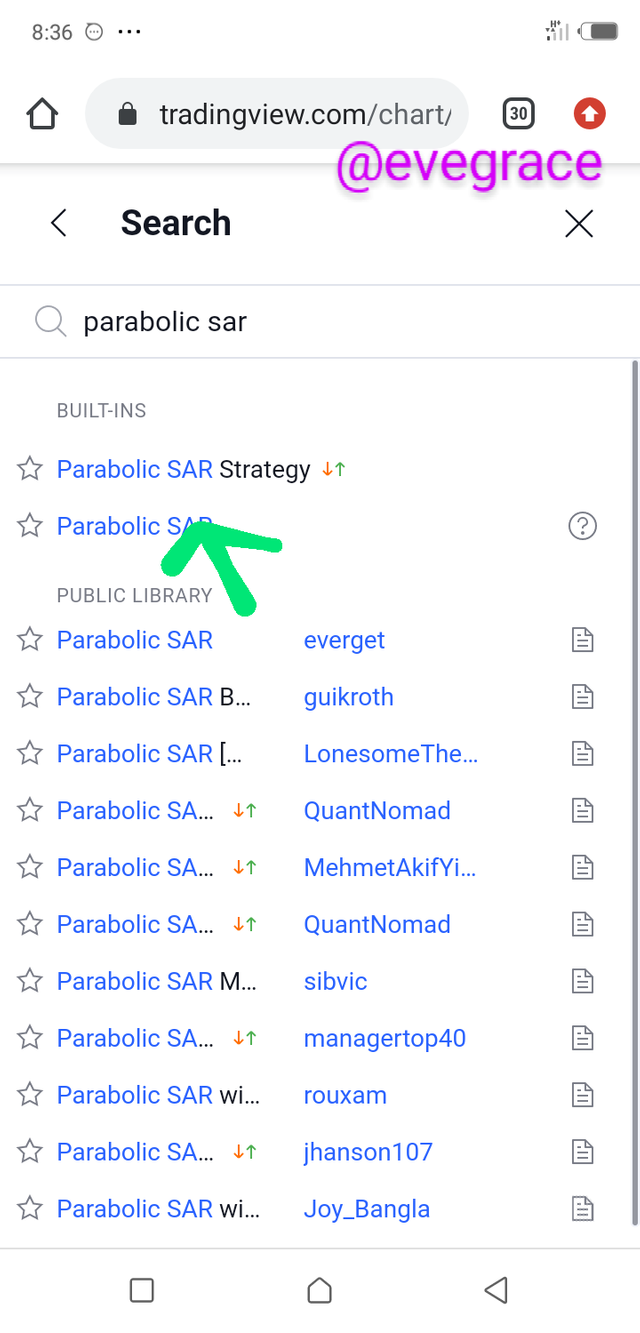
For this task, I will adding the Parabolic Sar indicator to my chart.
After clicking the indicator icon, a pop out window showed where I then searched for the Parabolic Sar indicator and it displayed, then I clicked on it and it was added to the chart as shown below.
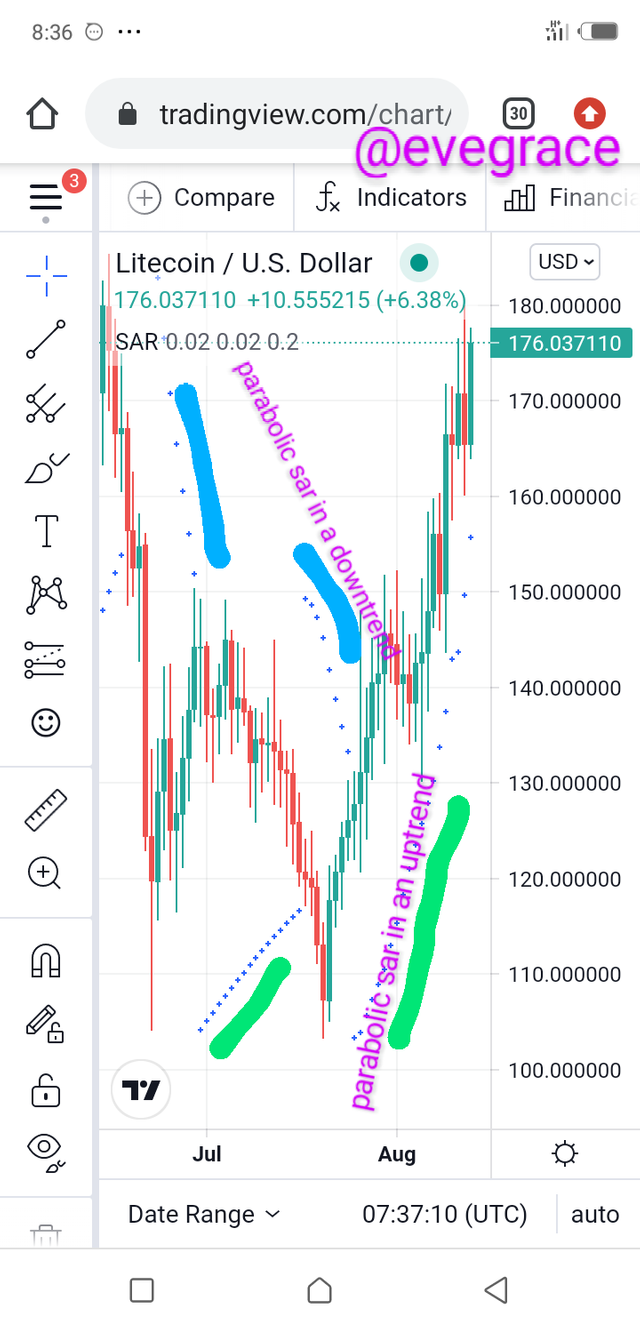
In the snapshot below, in a downtrend, the Parabolic Sar dots is indicated using blue arrow and that of the uptrend is indicated using green arrow.
Add the two indicators (Stochastic Oscillator + Parabolic Sar) and simulate a trade in the same trading view, on how a trade would be taken.
For this task, I will adding both the Stochastic Oscillator and the Parabolic Sar indicator to my chart.
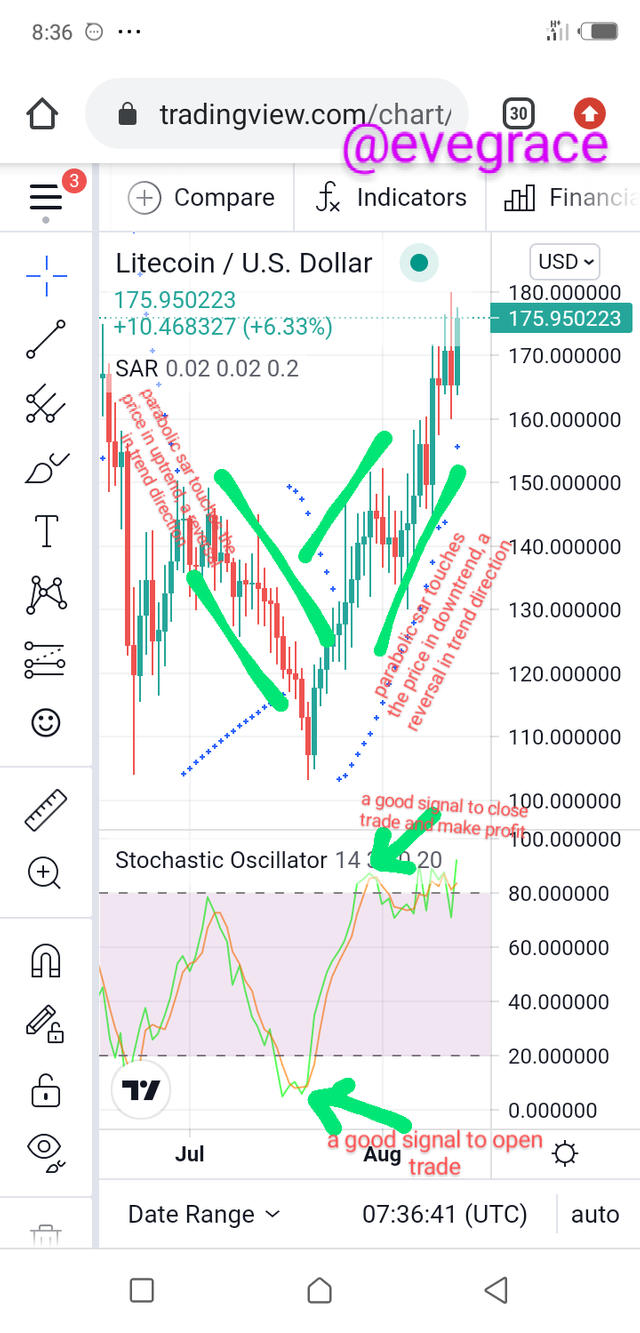
In the above screen shot chart, we see two indicators
In the Stochastic indicator, red line which is the %D line crosses over the the green line which is the %K line in the oversold area which indicates a reversal signal in the downtrend direction thus a good signal to enter a trade, also looking at the parabolic sar, there is a trend change from bearish to bullish trend.
when the red line crosses over the green line in the overbought area, it indicates a reversal signal in the uptrend direction this a good signal to exit a trade and make profit, also looking at the parabolic sar, there is a trend change from bullish to bearish trend.
Conclusion
The two indicators “Stochastic Oscillator and Parabolic Sar” are two great indicators which are very vital if used together by a trader or investor. These indicators will help traders if used and applied properly in spotting a good entry and exit point in the trading of an asset. It will give a trader the opportunity to identify overbought and oversold period thus giving the trader hint on the possible potential trend movement of an asset.
Thanks Prof. @lenonmc21 for the lecture, it was a great one.