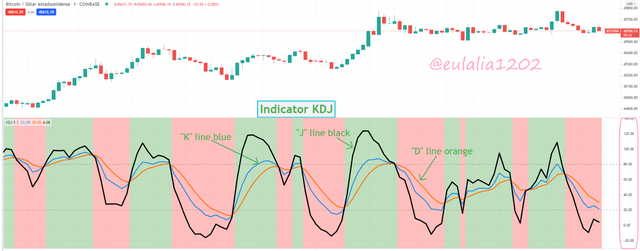
The random index or KDJ indicator, is known as an oscillating indicator that oscillates between 14 periods, indicates the direction of the trend, it is composed of 3 lines, K, D, J these oscillate between a bandwidth of 20 to 80, when the J line makes a jump over the K and D lines from the bottom up, it is because the trend will be bullish, and the 20 of the band means that it is an oversold point and an excellent buying point, on the other hand, if we see the line J to move from top to bottom lines K and D, it is a selling point because the trend will go down, if it makes this crossing in the 80 band it is an overbought point and we must sell to buy at a lower point, each Once the KDJ indicator makes a crossover, the color is defined by the generated trend, red for bearish and green for bullish, this indicator is very lucrative for reading trends, to open operations in oversold and overbought points in short and in long periods, to expand our margin of b profit.
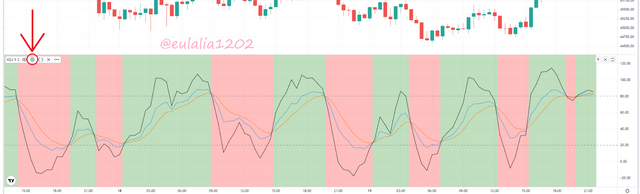
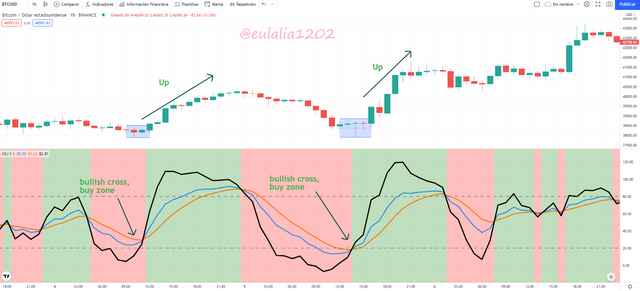
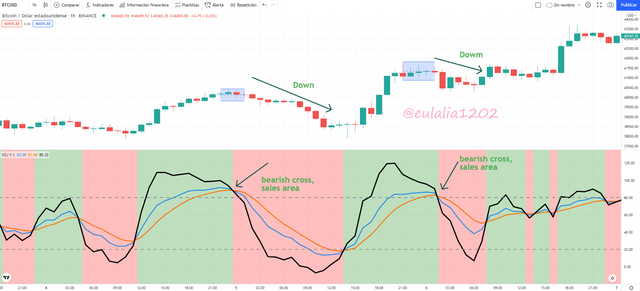
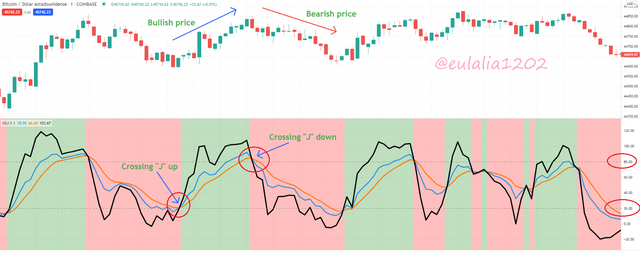
Here it is observed how the trend colors are generated when the J line crosses above the K and D lines at the 20 oversold point, the trend color is green, when the line reached an overbought point between the line of the 80s, the J line again crossed the K and D lines in a bearish way, acquiring the color red.
The indicator is calculated as follows.
Number of periods (RSV) = (CN-LN) = (HN-LN) * 100
CN = It is the closing price over the period (N), LN = It is the lowest price over the period (N), HN = It is the highest price over the period (N)
Calculation of D and calculation of K
K = 2/3 * K of the previous period + 1/3 * RSV of the current period
D = 2/3 * D of the previous period + 1/3 * K of the previous period
If you do not have the value of K and D from the previous period, they must be replaced by 50
J = 3 * price of the current period K - 2 * the price of the current period D.
9-period KDJ lines:
9 periods (RSV) = (C-L9) / (H9-L9) * 100
C = Closing price of the current period, H9 = Minimum price of the 9-day period, L9 = Maximum price of a 9-day period
K = 2/3 * 8k + 1/3 * 9 RSV
D = 2/3 * 8D + 1/3 * 9k
J = 3 * 9K - 2 * 9D
If you do not have the prices of K and D from the previous period, place 50.

Is the random index reliable? Explain
The random index is very useful to visualize strategic overbought and oversold points that are usually used to place a buy order and a sell order, it also projects signals of an upward and downward trend, this indicator is widely used in conjunction with other indicators such as ADX and Ichimoku, you should always have indicators that favor us in the use of the trend and especially in using the indicators that adapt to our needs, in addition to being able to join with our trading methods and strategies, the index Random KDJ, it is very adaptable to each of the indicators that relate the trend to carry out long-term hold operations or operations such as scalping, indicators should not be trusted, because all the markets that have been created in the market are created patterns that fluctuate from time to time in the market, and due to the psychological factor, many investors tend to follow a certain pattern in their operations , then one can be guided by means of an indicator, and carry out a study of all the necessary determinations to enter and exit the operation, so we will be entering orders correctly.
How is the random index added to a chart and what are the recommended parameters? (Screenshot required)
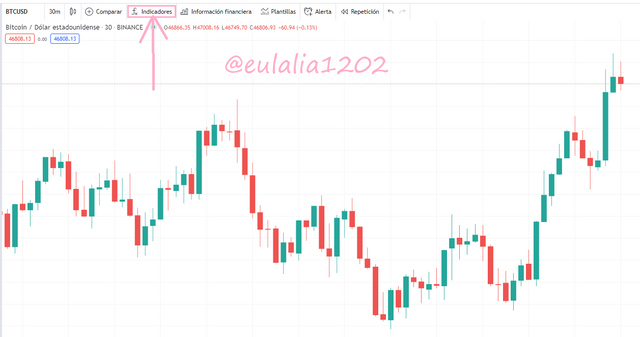
The KDJ indicator, because it is created by a user, can be added in tradingview, we do this like any other indicator, click on indicators.
Link
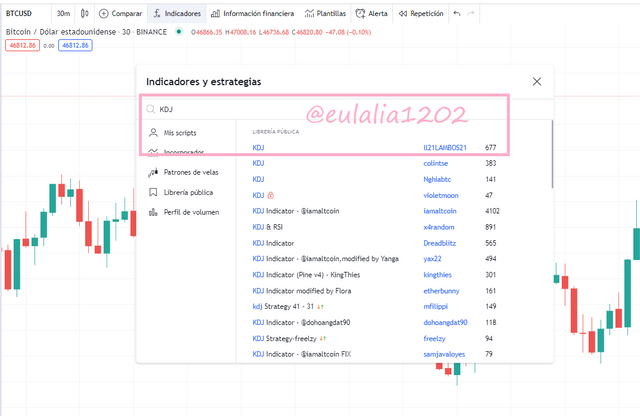
In the search engine, we will place the word KDJ, but our choice will be number 1, that of the user ll21LAMBOS21.
Link
Here we can see the KDJ indicator, let's see with conjurations that it has, we click on settings.
Link
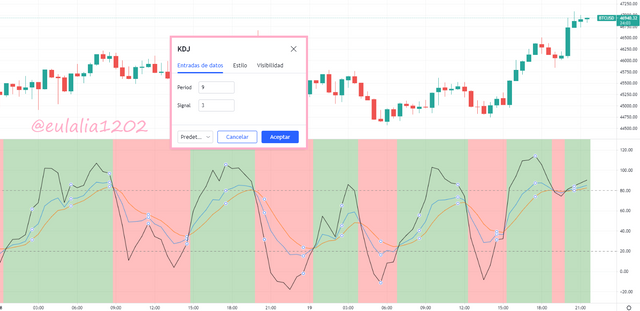
It comes by default of the creator user, of 9 and 3 periods, this has been studied by many tests and trials, but if it is not intertwined with your strategy, you can change it.
Link
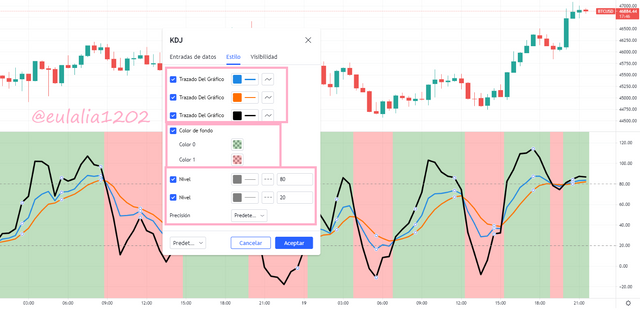
This is the configuration on the style of the lines, you can change the color (red and green) of the bullish and bearish trends, and we can configure the width of the band, which by default comes 80-20, for overbought and oversold points..
Link
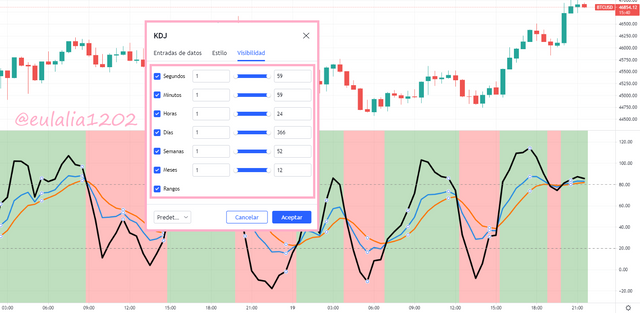
The configuration of the visibility of the periods by default all selected, we can change the reading if we wish.
Link
The recommended parameters to use the indicator are according to the operations carried out.
Purchase sign:
In the KDJ indicator, buy signs are seen when the J line, moves from bottom to top above the D and K lines, upwards, but this signal must be in the 20 band to be an oversold point, If the line does not go up on the 20 of the band, we have to wait for another entry signal and if the J line goes on the 20 of the band upwards, it is our buy signal.
Link
Sale sign:
In the KDJ indicator, sell signs are seen when the J line moves up and down above the D and K lines, down, but this signal must be in the 80 band to be an overbought point, If the line does not pass the 80 of the band bearishly, we have to wait for another exit signal and if the J line passes the 80 of the band downwards, it is our sell signal.
Link
Differences between KDJ, ADX, and ATR
ADX
ADX is an indicator to know the outside that the trend brings, in its band level it is from 0 to 100, and this band is divided into 4 parts.
ADX band standards:
(0-25): There is no trend or it is very weak
(25-50): A trend is appreciated, strong trend
(50-75): The trend is very strong
(75-100): Excessively strong tendency
The period that the indicator line oscillates is 14 but it can be configured to your strategy, this indicator does not measure the direction of the trend, only its strength.
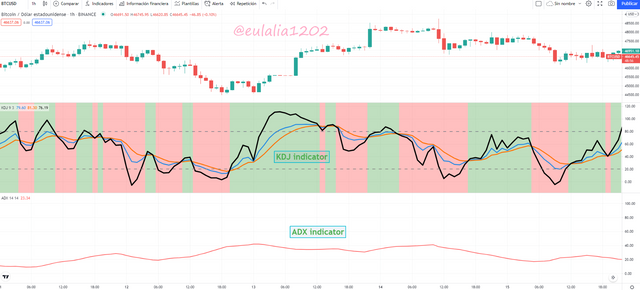
Link
ATR
ATR is an indicator to know how much volatility the market has, this indicator makes estimates about the number of orders placed and liquidity, it comes by default of 14 periods, in its band it is read between strong and weak standards, the larger the figure , the more there is volatility in the market.
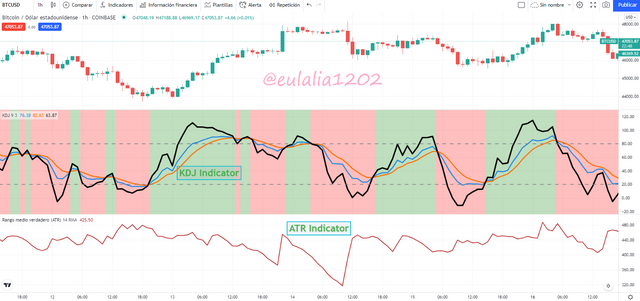
Link
Differences:
* The ADX indicator is an indicator to measure the strength that the trend brings, it does not measure direction or sense.
* The ATR indicator measures market volatility, it does not measure trend.
* The KDJ indicator measures direction and signals overbought and oversold signals.
The 3 indicators together are a good set to carry out entry and exit orders and they are very easy to understand, it is only advisable to experiment with them many times to get to know them better.
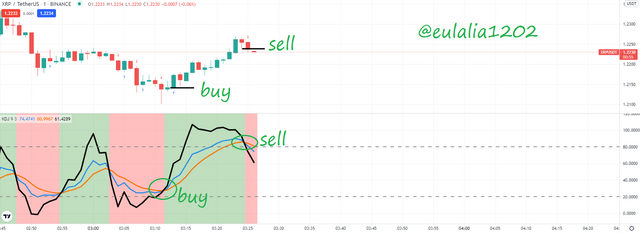
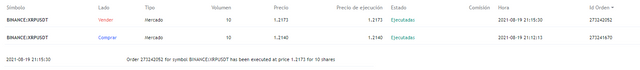
Use the signals of the random index to buy and sell any two cryptocurrencies. (Screenshot required)
As it is a new indicator, use test operations through tradingview, the first one was with XRP / USDT, here you can see the line J going from bottom to top through the 20 point of the band (oversold point) passing through the lines D and K and we have a buy signal, when line J continued to rise, it passed the 80 overbought line and had a reversal, passing again from top to bottom the D and K lines, (overbought point), here take the decision to sell.
Link
Link
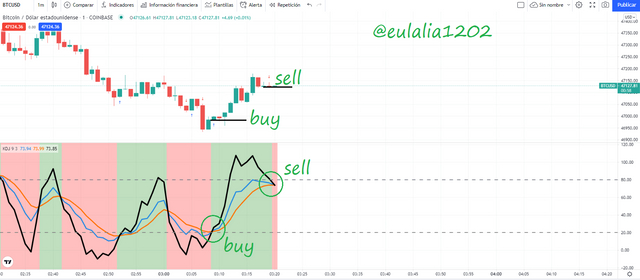
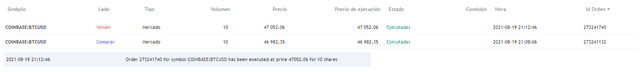
We have the following example with test operations with the BTC.
Link
Link
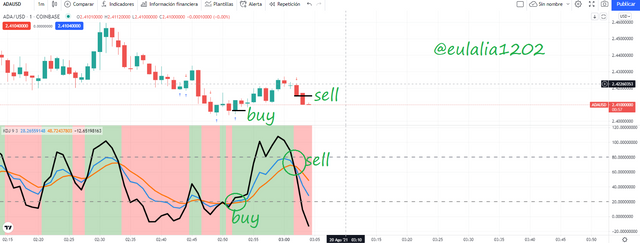
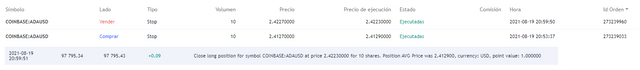
And with cardano to finish.
Link
Link
Conclusión
This week's class was impressive, because it introduced us to the KDJ indicator in depth which is used to place orders at oversold low points and overbought high points, we learned the differences between the set of ATR, KDJ and ADX indicators, All 3 are very good to have in practical use in our orders, this week's class was very good, I am satisfied with the learning.
Hi, @eulalia1202,
Thank you for your contribution to the Steem ecosystem.
Please consider voting for our witness, setting us as a proxy,
or delegate to @ecosynthesizer to earn 100% of the curation rewards!
3000SP | 4000SP | 5000SP | 10000SP | 100000SP
Good job @eulalia1202!
Thanks for performing the above task in the eighth week of Steemit Crypto Academy Season 3. The time and effort put into this work is appreciated. Hence, you have scored 7.5 out of 10. Here are the details:
Remarks
Overall, you have displayed a good understanding of the topic. You have performed the assigned task excellently. However, you did not provide new information to this course, as most of the points mentioned have been indicated by several participants.
That said, this is good work. Thanks again for your contributing your time and effort to the academy.
Thanks, teacher