Steemit Crypto Academy Season 4 - Homework Post for Task 10 //@essygold/27/10/2021
1a) Explain the Japanese candlestick chart? (Original screenshot required).
b) In your own words, explain why the Japanese Candlestick chart is the most used in the financial market.
c) Describe a bullish and a bearish candle. Also, explain its anatomy. (Original screenshot required)
1a) Explain the Japanese candlestick chart? (Original screenshot required).
Knowledge is very important in every business venture that someone wants to embark upon. The same applies to Cryptocurrency though it’s a digital money, someone need to learn the trade rules and watch the market moves so that one can successfully become an expert on it and always make profits during the trading.
THE JAPANESE CANDLE STICK
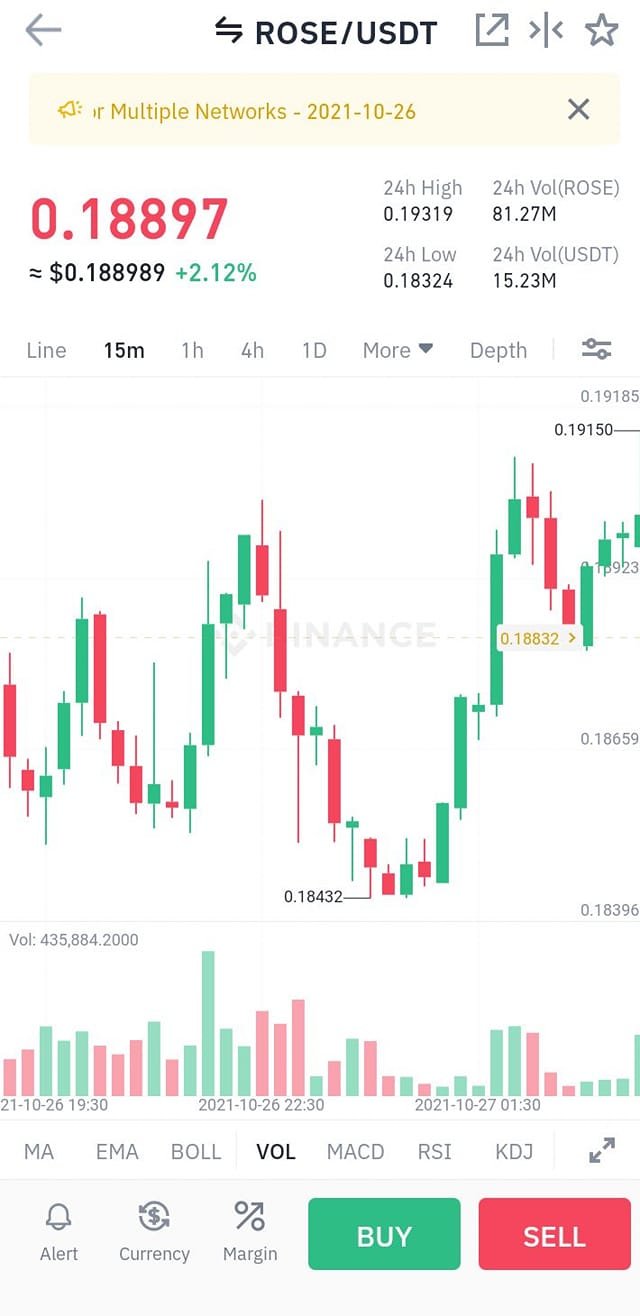
The Candlestick are the main requirements in analysing the Cryptocurrency market. Candlesticks are the only tool used to technically analyse an effective trading giving us the background of each coin market operation. The Japanese Candlestick is mostly used by all in the financial market to get the graphs representation in price of an asset or coin and it is formed when buyers and sellers are interacting for a particular trade.
Munehisa Homma in the year 1700 developed it in Japan to be used for his Rice trading. As he studied how the market moves, he determined to study the price rotation between supply and demand to know when to buy and when to sell. He succeeded and created the candlestick which is still in use till date.

Screenshots taken with my A7S UMIDIGI Brand
These candlestick chart means a lot to traders in the Crypto space. It tells traders how prices of coin are moving and the pattern of its rotation showing them exactly price point records. Candlestick chart conveys a huge role to traders for analysing good technics in the market price pointing towards the future movement of price.
The candlestick chart plays a significant role indicating the reaction between buyers and sellers and showing who is in control of price in the cryptocurrency trading.

Screenshots taken with my A7S UMIDIGI Brand
b) In your own words, explain why the Japanese Candlestick chart is the most used in the financial market.
Every trader is always looking out for what will make him buy and sell with good returns on profit. Traders in the Cryptocurrency found the Candlestick as a helpful tool in analysing the market with accuracy, hence they stick to it. Traders have learnt how the patterns occur in the chart dating back to its origin, they found out that the brain behind it is basically on demand and supply of assets and that is what traders are looking for, buying low and selling high. If you read and study these patterns well you will get an accurate market trend.
The Candlestick is like a map that guides traders in determining the financial market. It informs Traders when to go into the market fully and get a positive result. Outside the crypto space there are times when market is said to be dull and at that time traders will wait for the market to pick up - its peak - before going in fully for the demand and supply. The same scenario happens with the candlestick, its patterns also shows traders that price opened and closed at the same time, so when such happens they have to wait since they are not in control of the market trend. The candle stick shows the market behaviour and also tells traders which party is in control of price.
c) Describe a bullish and a bearish candle. Also, explain its anatomy. (Original screenshot required)
There are 2 types of candlesticks that traders are looking out for. The Bullish and the Bearish Candlesticks which are determining factors in the Cryptocurrency market. Each can be said to engulf the other depending on the pattern and movement of the candlestick.
BULLISH CANDLESTICK PATTERN
The Bullish are the Buyers, the indicator candlestick is color green, when these candlestick body covers the second candle fully up and down, then buyers takes control of the market by purchasing more assets. When these candle appears in the uptrend engulfing the second candlestick, showing an uptrend reversal then traders will quickly know that it is time to buy as the price has reversed. It is the length of the engulfing candle stick being longer than the previous candle that determines traders movement in the market, in this way the Bulls take over and swing to buying.
Screenshots taken with my A7S UMIDIGI Brand
THE BEARISH CANDLESTICK PATTERN
This is a Candlestick with a colour indicator as red. When the Bearish red Candlestick opens above the green colour bullish Candlestick then sellers are in control of the market. As the length of the Bearish Candlestick is longer up and down engulfing the previous candle from where it starts to form, the sellers has taken over and starts selling to make more profits. It is after the formation of the candlestick that sellers have taken control of price determining how much the market price will be sold at.

Screenshots taken with my A7S UMIDIGI Brand
From the structure ofthe Candlestick already discussed, the Bearish engulfing candle has a close below where the Bullish candlestick started to form.
THE ANATOMY OF THE CANDLESTICK
The graphic illustration of the Candlestick has 4 parts that buyers and sellers use to interact within the market, showing different points in price.
Open (Opening Price) shows the beginning of price movement recorded within a specific point in time.
High (Highest price) is an indicator showing the highest price record within a specific time as the price moves up in the market trend.
Low (Lowest price) At this point the candlestick indicates the lowest point the market goes downward at a time.
Close (Closing price) This is the ending mark indicator of price recorded in the Candlestick, infact it is the last price that the market offered at a particular time period.
The Shadow shows the struggle in price that buyers and sellers experience, the areas that the price passed through but could not close the market.
The main Body of the Candlestick shows how far the price was able to cover at a particular time. It marks the space between the opening and closing price showing the Candlestick movements. Traders usually chose colors to differentiate these 2 bodies while setting up their charts. Usually Red and Green colours are often used for the body of the candlestick, with other tools to specify their trading system in the chart.
cc:
@reminiscence01
#club5050 😀