Crypto Academy / Season 3 / Week 7 - Homework Post for Professor @yousafharoonkhan
Hi guys, welcome to a new week at steemit crypto academy. Today I'll be making a post about the Tradingview platform. This post is my homework submitted to the professor @yousafharoonkhan .
Define the TradingView site and how to register an account in trading view? what are the different registration plans
TradingView site is a technical analysis platform for traders. Most of the traders use this site to do technical analysis in cryptocurrency, forex, stock, or any other field.The trading-view platform provides access to charts of all sorts and displays current market prices in realtime.
TradingView site is a technical analysis platform for traders. Most of the traders use this site to do technical analysis in cryptocurrency, forex, stock, or any other field. Tradingview is a very important site for mostly traders of cryptocurrency. It helps to analyse the market, knowing the right time to enter in market and the time to sell it off. To get this feature you have to buy their monthly or annual package.
Traders can draw anything on this site by using the chart feature and they can creating their drawing through different tools available on TradingView chart.
Here we can see how to create an account in Tradeview
At first we need to visit the TradeView official site. and You can see the icon indicating the start free trial on the next page we will redirected to the package details we will discuss about that on later. Click Start free trail.

On the next page we will see the user interface like this. If you already have account means you can login or new user mean you have to create the new account so I am here just clicking the sign up button.

Here I am using my email id to create an account you can choose your ID accordingly. Fill the username and email and passwords. after filling the credentials click on the two check boxes and click I am not a robot and finally click Create account.

An confirmation mail will sent to the registered email just fill it and verify the account.

And this is my account created and logged in with the appropriate password and the email. It was indicating me to upgrade my account to access the fullest.

Number of indicators per chart.
number of chart in layout.
server side alerts.
Ad free.
Number of devices.
many more features in the tradeview make the users to upgrade into three catogery group.
Explain the different features of tradingView and what is your favorite feature and why?
Charts
The chart is my favourite feature cause as a trader the basis of fundamental analysis and trading entirely is the ability of one to interpret and understand charts, absolute knowledge of the chart feature helps reduce lost in trading by a lot, hence the chart is the most important feature of TradingView platform. There are many editing tools in the charts that are easy to use to find the proper market trend.

Screener

This section is divided into 3 parts. Stock Tracker, Forex Tracker, Crypto Tracker.This screener helps user to track the price of different token, crypto price at different exchanges. you can search for the asset you want in the search section, or you can sort the assets according to the criteria you have determined by filtering method.
Communities

These communities are helping to create a lot good things for the traders like steemit they also have many blogs to understand the use of chart available. In this place traders can interact to share idea about market. They can also do streaming.
How to set up a chart in TradingView and use two tools to edit it.
I love to use the trade view because of the pre customized tools to predict the support and the resistance point of the market by simply just dragging it.

You can see here there are numerous variety of market chart drag makers are available I am here showing you the resistance and support line tracker with just two clicks. I always use Pitchfork and see the result in the next image.

I just dragged the line from where I need to get the next support and resistance level you can see those resistance line have been worked perfectly I was doubting myself if I put it by myself will not be this much accurate to predict the trend.
Measuring chart

We doesn't need to calculate the period of entry and exit profit by any calculation. There is a tool called measure which will provide the detailed information about the market price entry percentage of profit or loss time period everything. This would reduce the numerous amount of my time.
Adding indicators in the chart and Favorite indicator.
Here I am going to explain about how to add the indicators.
At first you need to go for any chart and click the fx symbol as I indicated in the above image.

When you click the fx the user interface will apear like this. Search the indicator you need and add it to your chart.

Here I am going to explain about the two indicators I loved the most.
ADX
ADX is a technical indicator used to determine the strength of a trend on the chart of a cryptocurrency asset. ADX stands for Average Directional Index indicator. It is not majorly used for filtering false signals. ADX generally does not generate buy-sell signals, but rather gives traders an idea of whether there is a trend or not. ADX also allows us to determine how strong the trend is.
Bullish trend
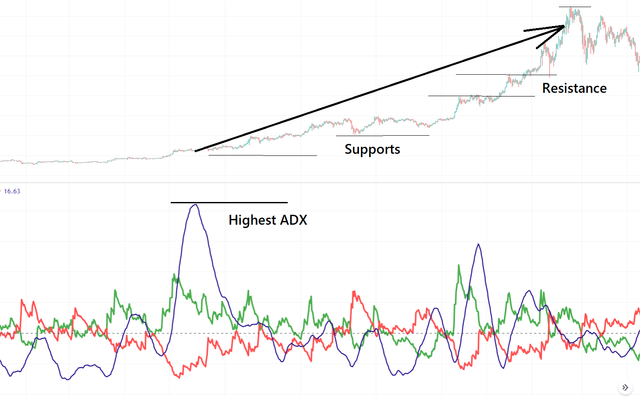
At this point, you can see the ADX value is greater than 50 and the indicator confirms that the signal was true and the trend is going to be bullish. In the above chart, you can see that the graph has already breakout the many resistance and took many support confirms that the bullish trend. ADX indicator is used to determine the strength of the trend. In this way, we can understand whether the Breakouts are real or fake with the ADX indicator.
Bearish trend

You can see here the ADX value is decreasing gradually hence the value of the market is also trending here a large number of sellers are available than the buyer hence the trend reversal happened. Hence this is ADX filter helps to determine the false breakouts.
MACD

Two factors crossing of two MACD lines and the signal line and these intersection happens at the zero line are important here. When this thing happens there will be an inverse in the market.
Need to put the line on the chart that connects the higher high or lower low of price chart and MACD chart and look into it if the flow was in inverse I mean if the price chart gives down line and MACD shows up line means it gives a strong signal of a bullish market.
Chart that connects the higher high or lowers low of price chart and MACD chart and looks into it if the flow was in inverse I mean if the price chart gives up line and MACD shows down line means it gives a strong signal of a bearish market.
To filter the false signal we have to know about more indicators. We have to seek the same signal that gives confirmation for the trend is inverse.
Do you think TradingView is useful in predicting the market for cryptocurrency (trend / price)?
Absolutely Yes, Predicting the piece was the greatest mantra of the trading. Tradingview is very useful in predicting the market for cryptocurrency price. Most of the traders use this for their technical analysis. This site is very handy and easy to use. There is a free basic option for free users. There are also premium options for advanced traders. If we did any assumptions manual have any possibilities of human error but with the help of tools in tradeview gives one hundred percent perfection.
For example, above mentioned two indicators are showing their accuracy and I was loving it to use to bag my profits.
Conclusion
TradingView is one of the best platforms consists of numerous tools which they are providing free for basic levels. I would suggest everyone to use tradingview not only in order to predict but also you can choose the best exchanges where you can buy the cheap crypto in the screener section as I mentioned above. Thank you professor @yousafharoonkhan for a wonderful lesson. I learned a lot thanks for it :)
Congratulations! Your post has been selected as a daily Steemit truffle! It is listed on rank 21 of all contributions awarded today. You can find the TOP DAILY TRUFFLE PICKS HERE.
I upvoted your contribution because to my mind your post is at least 6 SBD worth and should receive 16 votes. It's now up to the lovely Steemit community to make this come true.
I am
TrufflePig, an Artificial Intelligence Bot that helps minnows and content curators using Machine Learning. If you are curious how I select content, you can find an explanation here!Have a nice day and sincerely yours,

TrufflePigHi @erode
Thanks for participating in the Steemit Crypto Academy
Feedback
This is good content. Well done with your practical study on Tradingview.