Advanced Course - Trading Crypto with Average Directional Index (ADX) Indicator || Homework post Crypto Academy
Hi guys, welcome to a new week at steemit crypto academy. Today I'll be making a post about the average directional index indicator. This post is my homework submitted to the professor @kouba01.
What is the ADX indicator?
ADX is a technical indicator used to determine the strength of a trend on the chart of a cryptocurrency asset. ADX stands for Average Directional Index indicator. It is not majorly used for filtering false signals. ADX generally does not generate buy-sell signals, but rather gives traders an idea of whether there is a trend or not. ADX also allows us to determine how strong the trend is.. As we have grades in our college here too we had certain grade levels which is listed below,
| ADX Range | Implications |
|---|---|
| 0-25 | Weak strength or Low grade |
| 25-50 | Strong trend or medium grade |
| 50-75 | A very strong trend or Good grade |
| 75-100 | Extremely strong trend or Best grade |
By the above range of our value, we can get our best entry and exit position of the market which we are analyzing.
Directional Movement Index (DMI) Indicator used with the ADX makes it more flexible in understanding the market we are analyzing.

In the above-mentioned picture, you can see
ADX line (Blue), DI+ line (Green), DI- line (Red) form the ADX indicator. The colors of these lines can be customized.
DMI curves consist of two lines as we can see. These are DI+ and DI-.
DI+ line shows us the strength of the uptrend. DI- line represents the strength of the downtrend.
ADX Calculation
To calculate the ADX indicator,
DMI+ = day high - previous high
DMI- = previous low - low of the day
TR = Max (|Current high - current low|)
&(|Current high - previous close|)&
(|Current low - previous close|)
DI+ = DMI+/TR
DI- = DMI-/TR
ADX = [|(DI+) -(DI-)|] / [|(DI+) + (DI-)|] * 100.
Here is the written example calculation.

How to add ADX, DI+, and DI- indicators to the chart, what are its best settings? And why?
Firstly, go to https://tradingview.com Because I was explaining with tradeview site. The site UI will appear as I mentioned below.

Let's move to the chart section and we can apply our setting for that choose one of the charts for example I am going to choose the chart of 1INCH USDT.
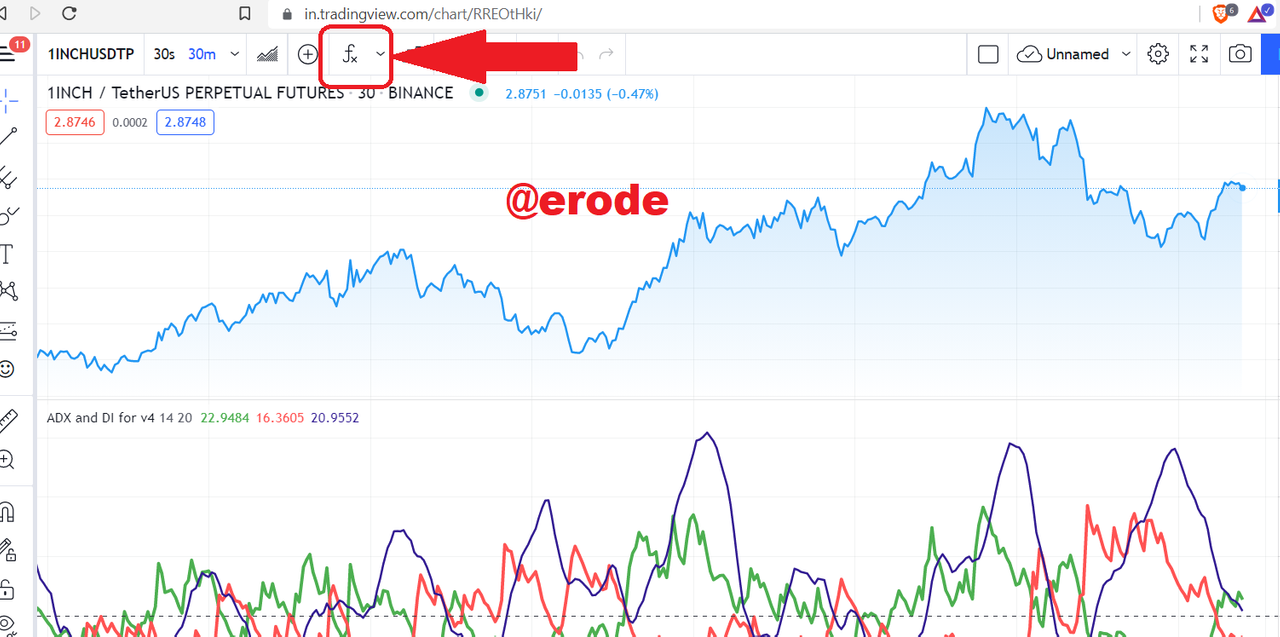
Click on the fx which is the technical indicator adder symbol. and you will see the below screenshot picture UI give us to search the tool. I searched there as ADX as we need it in our chart. and the result of the search will be listed below the search bar.

Here I am choosing the ADX and the DI part as I was in need of it. And we can choose the settings as we need here in the below screenshot I showed how to move for the setting of the indicator.

Click on the Settings button on the side of the indicator it will allow us to edit the color of each line and its thickness. Along with it, you can see the input button on the side which will allow me to do the required chart for a certain time period.

By the value of time, we are changing will give me the signal of short time or long time trades. It varies from user to user.
The best setting for the ADX Indicator (why it's best)
That's a 14 days length period for Directional Index. It means that the calculation of the indicator is based on the last 14 periods of the time frame. If it is a one-day timeframe, it means the last 14 days are taken into consideration for the calculation.
We can change the settings for our needs and can be helpful depending on your trading style. What one must note is the shorter the period, the more indicator is to changes. This can cause a lot of false and misleading signals. Longer length periods help to smooth the curve. I suggest setting the length of possible high in order to get a good smooth curve and reduction in false signal.
Do you need to add DI+ and DI- indicators to be able to trade with ADX? How can we take advantage of this indicator?
DI+ and DI- are the two important indicators used here to confirm the reverse trends here. Here DI+ I mentioned it with a green line and DI- indicated in red line and ADX line is indicated in the blue line.
The DI+ and DI- indicators are also components of the Directional movement system developed by Welles Wilder. They are the main components of the Directional movement index indicator. They are very helpful and needed to be able to trade with the ADX indicator. Some traders use just the DI+ and DI- indicators for analysis and trading. The ADX only helps to identify the strength of a trend without indicating the direction of the trend. The DI+ and DI- lines help to tell the direction of the trend. And so Yes, the DI+ and DI- indicators are needed to trade with ADX.

Here when the DI + crosses the DI- upside gives us a bullish signal. For example, when the green line goes above the red line it indicates the price is going to increase. When it happens inverse it will decrease I mean when the red line crosses the green line the price decreases. The above screenshot is a good example of it.
When the ADX range hits 0-25 it was just a weak confirmation and we can only assume 25% of the assumption will happen. above 25 to 50 may happen 50% of chance and above 50 to 75 approximately happens around 75% of confidence when reaches above 75 surely positive signal of the bullish trend.
What are the different trends detected using the ADX? And how do you filter out the false signals?
Here most of the traders get liquidate while using ADX and DMI alone look here the ADX indicator showing higher strength peaks and your analysis that market price action is in bearish mode and furthermore the ADX falls without price reversal and ADX is in not work alone we need to combine two or more indicators to confirm the action. As I mentioned above this indicator doesn't alone give us the exact confirmation of the reversal trend it will help to confirm when combined with multiple indicators. For example, RSI, Moving average convergence divergence, etc.

Here I mentioned 7 days short term trade signal and 30 days for long term trade. False signals can be filtered very easily with the ADX. As shown earlier with how the ADX reacts with the 8 and 30 length periods, you can easily take out false signals. The reaction of the ADX is very quick with short length periods. It often gives a lot of wrong and misleading signals. A longer length period smoothes the ADX and filters out the wrong signals. Do not forget the recommended range for the ADX length period is 7 to 30. A length above 30 ( Long term trade ) would filter out false signals and might make you miss important signals as well.
Explain what a breakout is. And How do you use the ADX filter to determine a valid breakout?
The movement of price above or below areas of resistance or support after a range with increased momentum in price movements. This usually happens when traders buy or sell in large volumes continually for a period of time. They are common in all markets.
Bullish trend

At this point, you can see the ADX value is greater than 50 and the indicator confirms that the signal was true and the trend is going to be bullish. In the above chart, you can see that the graph has already breakout the many resistance and took many support confirms that the bullish trend. ADX indicator is used to determine the strength of the trend. In this way, we can understand whether the Breakouts are real or fake with the ADX indicator.
Bearish trend

You can see here the ADX value is decreasing gradually hence the value of the market is also trending here a large number of sellers are available than the buyer hence the trend reversal happened. Hence this is ADX filter helps to determine the false breakouts.
What is the difference between using the ADX indicator for scalping and for swing trading? What do you prefer between them? And why?
ADX for Scalping trade
The investors that trade lower timeframes like 1 minute, 3 minutes, 5 minutes 15, and 30 minutes, can identify trends, and the strength of the trend using the ADX indicators with lower settings. In the case of using the ADX indicator during scalping trading, shorter period periods can be used instead of the 14-period period. However, the rate of false signals produced as a result of its use will increase. It is possible to filter these false signals using additional indicators. The ADX indicator can be used with other indicators like price action, Moving averages, average true range, etc. for scalping on the lower timeframe. Personally, I didn't recommend using it for scalp trading which will results in many false signals.
ADX for Swing trade
The investors that trade lower timeframes like 1 hour, 2 hours, 4 hours, the 1-day chart helps identify trends, and the strength of the trend using the ADX indicators with medium or higher settings.
when trading swings with the ADX indicator, we can avoid unnecessary signals and traps by using longer timeframes. By integrating additional indicators with the ADX indicator, we can identify more accurate trading points and this is more recommended we can get the smooth curve of ADX without sudden high and low results in false signals.
The difference between ADX in scalping and swing trading is that, in scalping, it's a slightly long time duration and with long timeframes, scalp trading is that, in scalping, it's quick and with short timeframes. I personally recommend swing trade :)
Conclusion
Unlike most of the indicators, it doesn't only have a single graph line to confirm we have three lines which are DI+ DI- and ADX line to confirm the signal we assumed. Although I personally use this indicator to perform long-term trade instead of short-term trade.
In the recent time of the cryptocurrency boom, there s a lot of newcomers in the crypto world losing a lot of money without understanding the nature of the market they blindly invest money at the wrong time. Thanks for the author @kouba01 wonderful lesson about the technical analysis lesson I learned a lot and I am sure many of the steemians get used to it.
Hello @erode,
Thank you for participating in the 7th Week Crypto Course in its third season and for your efforts to complete the suggested tasks, you deserve a 3/10 rating, according to the following scale:
My review :
ADX = Sum of n [DX] / n, So to get the correct ADX result, you need to calculate DX values for at least n periods then smooth the results.
The ADX can be used without the DMI, but the DMI makes it easier to read the indicator. The DMI shows the direction of the market. Its operation lies in the fact that it measures the highest and lowest prices over a period.
In the second question, your answer about best setting was superficial as you did not go into details and did not provide some illustrative examples.
The same goes for how to extract the false signals and determination of breakout points by using the ADX indicator.
A short explanation of two methods of trading with ADX indicator, as you confined to stating generalities without going into more details.
Thanks again for your effort, and we look forward to reading your next work.
Sincerely,@kouba01