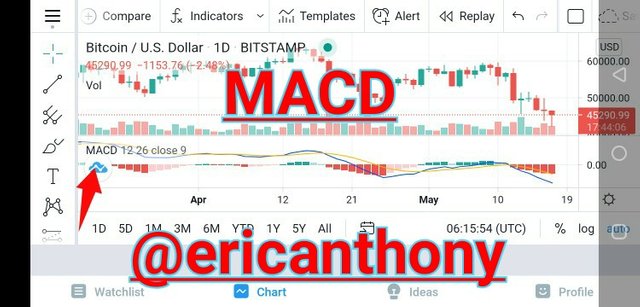
Crypto Academy Week 14 || Homework Post for Professor @kouba01 || Crypto-Trading With MACD Indicator
Hi Steemians, I'm @ericanthony and this is my homework post for Professor @kouba01's lecture on Crypto-Trading with MACD indicator. Hope you enjoy it. Thanks
What is the MACD indicator simply? Is the MACD Indicator Good for Trading Cryptocurrencies? Which is better, MACD or RSI?
It was developed by Gerald Appel in the late 1970, as a tool that utilizes moving averages to determine the momentum of an asset.
MACD is a technical indicator that is used to identify buy and sell points by looking at the changes in the momentum.
Is the MACD Indicator Good for Trading Cryptocurrencies? Which is better, MACD or RSI?
MACD is very good for trading cryptocurrencies because, it provides the traders with tools for better price analysis. It makes use of three major indicators;
- MACD line
- Signal line
- Histogram.
The activities and the interaction of these three indicators provides a detailed analysis for the trader, however, it does not show Overbought or Oversold.
RSI & MACD, are both momentum indicators for technical analysis. They perform better when used together. To select one out of the two is a little difficult. However, on my personal opinion, RSI appears a better choice, because it is simple to read and understand the price movement in the chart and also it seems a little bit faster than MACD.
How to add the MACD indicator to the chart, what are its settings, and ways to benefit from them? (Screenshot required)
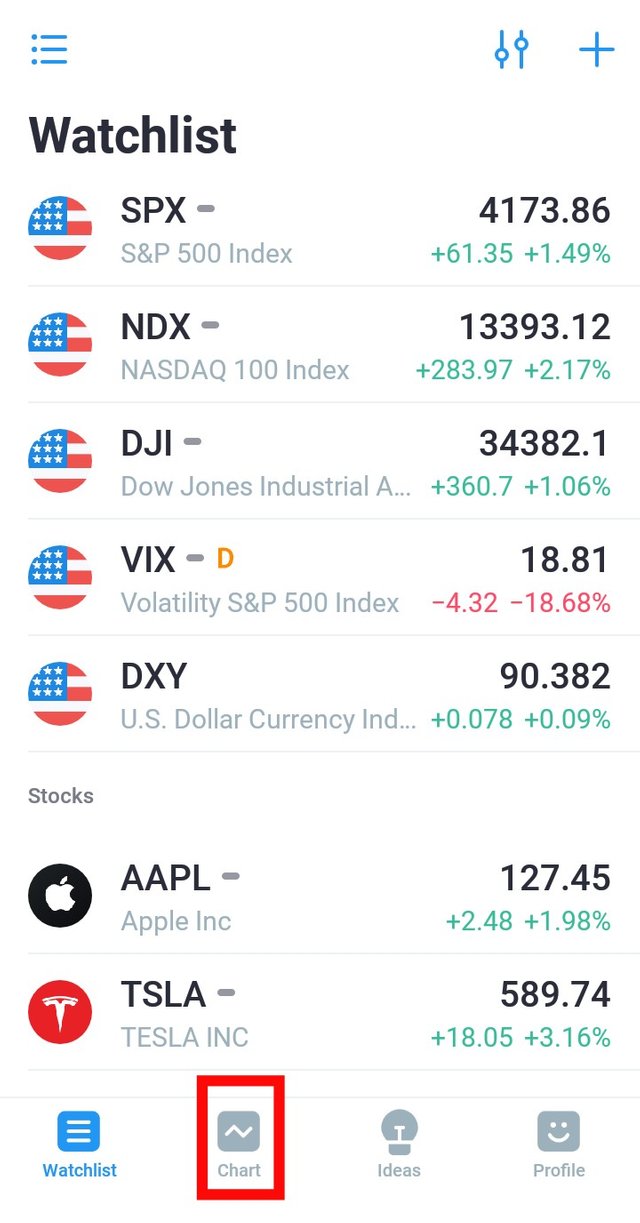
I used mobile tradingview for the demonstration on how to add MACD.
Step1. Launch the app. and click chart.
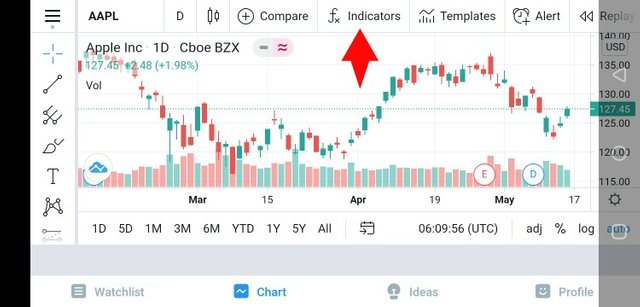
Step2. Click on Fx Indicators.
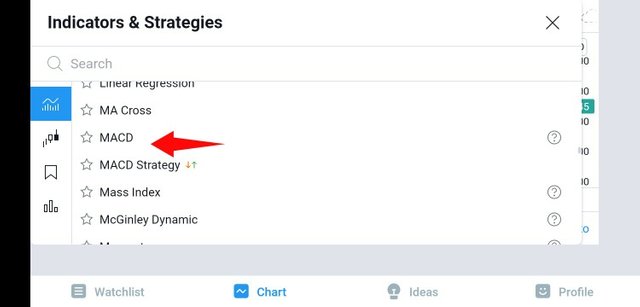
Step3. Scroll down and select MACD.
Traders can benefit from them by taking advantage of the indicators of MACD( MACD line, Signal line and Histogram.) To determine the trend and momentum of the price and also potential reversals. With those informations, traders can be able to predict entry and exit points.
How to use MACD with crossing MACD line and signal line? And How to use the MACD with the crossing of the zero line?
When MACD line crosses above or below the signal line, it indicates a change in trend.
However, when MACD line crosses from above to below the signal line, it is deemed bearish, the further above the zero line as it descends, the stronger the trend/signal.
So also when the MACD line crosses from below to above the signal line,it is deemed bullish, and the further it goes towards the zero line, the stronger the trend/signal
How to detect a trend using the MACD? And how to filter out false signals? (Screenshot required)
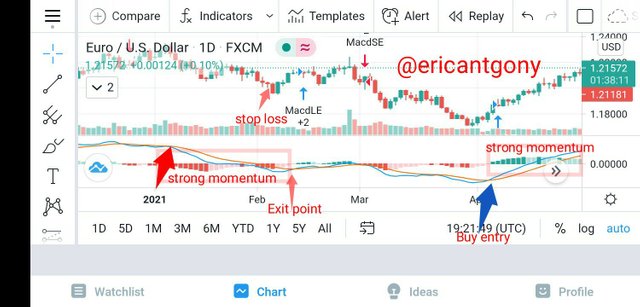
Change in trend for the entry point and exit point
This happens when the MACD line crosses let's say below the signal line, which may indicate entry point for sell signal, and when the MACD line touches the signal line moving above the signal line, it indicates an exit point.
A false signal can be filtered out with the use of the following:
- Stop loss order
- Combination of MACD and RSI
Histogram plays an important role in dictating false signals because you will be able to see how strong the momentum is. However, the combination of RSI and MACD provides a better information to guide traders decision.
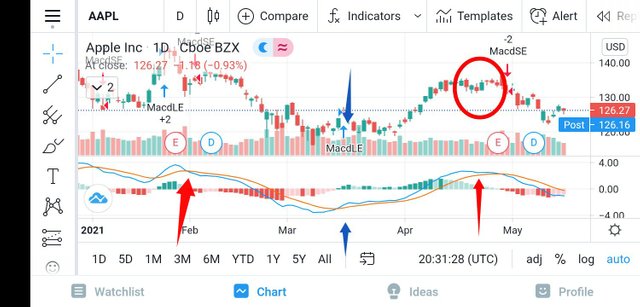
How can the MACD indicator be used to extract points or support and resistance levels on the chart? Use an example to explain the strategy. (Screenshot required)
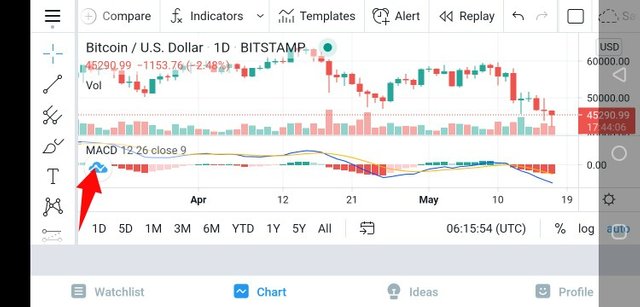
Here, traders can extract points by looking at the movement of the MACD line, Signal line and the Histogram.
As seen in the screenshot, the MACD line crossed the signal line, making a bearish move towards zero line, the histogram now made it so obvious that the bearish trend is strong which is considered sell signal. So also, as the MACD line moved from the bottom to above of the signal line, it's an exit sign, as Confirmed by the shrinking histogram. So also the bullish move towards the the beginning of March.
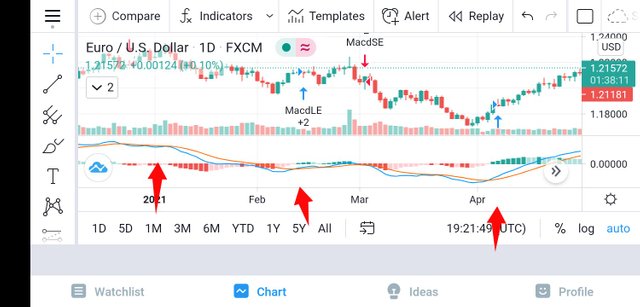
Review the chart of any pair and present the various signals from the MACD. (Screenshot required)
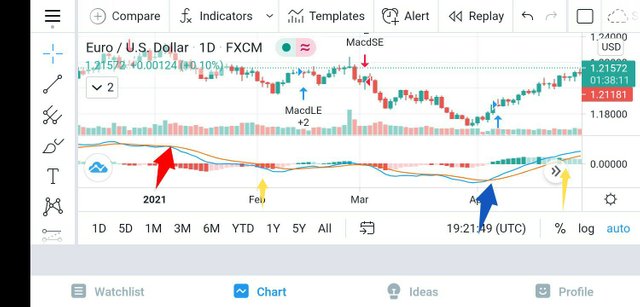
From the screenshot, we have EURO/USD chart. Here, from the beginning of January 2021 as the price drop the MACD line drops in response, while the histogram shows a strong bearish trend that terminates towards the middle of February.
By April, there was another change in trend as MACD line responds to the bullish price change as the histogram shows a positive value.
Hi @ericanthony
Thanks for your participation in the Steemit Crypto Academy
Feedback
This content is below average. You just simply tried though not good enough. Kindly invest enough time in both your research and in writing your articles.
Homework task
4