Crypto Academy Week 14 - Homework Post for Crypto Professor @fendit - Elliott Wave Theory.
Hi Steemians this is my homework post for Professor @fendit on Elliott Wave Theory (EWT)

What is the application of this theory?
Before now. It is believed that market price trends or nature is chaotic (zigzag) but, Ralph Nelson Elliott thinks otherwise, based on his research on the said topic. He believed that there is an organize predictable trend in the chaotic market cycle.
To correctly identify Elliott Wave Theory (EWT) in the real life price trends is very challenging.
However, when correctly identified, we as investors will be able to technically analysis the price trend and be able to make right decisions before trading.
As hinted by EWT, that the market patterns are very predictable, because of the predictable investors psychological deposition, when it comes to trading.
In application, the impulsive wave can be either bearish or bullish.
The first impulsive wave of the bullish trend for example, is usually the beginning of a cycle, where some investors buys an asset at a low price somewhere at the bottom of the uptrend.
The second wave; few of the investors may feel that they are not greedy so, they sold off and made some profit, as a result, the market regressed a little less than 50% of the progress made in the first wave.
On the third wave, the investors probably realized that:
- The price did not crash as they expected so, could still go up.
- That they can risk it to reinvest the profit made earlier.
- Other investors could also gather confidence to invest, after seeing that the last two waves seems promising.
That translated to the fast bullish trend in this third wave.
The fourth wave, here, the over-careful investors haven seen the progress the price has made, sold off and take profit and as a result the price regressed once again.
The fifth wave; here some of the investors, that have taken huge profit in the third wave, becomes apprehensive because, the price is about its highest high and pulled back and some that has been observing all along now decides to join the trend to grab their own share. So as the bullish trend continued. Most of the investors that maintained there position from the first and second wave to the fifth wave now pulls off and take home huge amount of profit.
As a result, the market plunged into bearish trend.
As believed by Eliot that all these market trends are as a result of investors trading psychology.
Now to answer the question directly,
EWT can be applied on our trading activities.
It's a tool to guide us on proper observation, to know exactly the entry and exit point of most of the market trends and also to know at what point to place stop loss in order to make a reasonable profit.
In otherwords; it provides us the knowledge to take full advantage of other investors psychology to our advantage. However, I personally don't think is a complete foolproof tool but, I can agree that it is a strong guide.
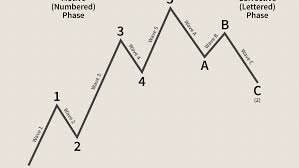
What are Impulse and Corrective Waves? How can you identify them?
These are waves that move with the market flow and they are five in number. They could be bearish or bullish in nature, depending on the market trend.
These waves are in the opposite trend. They are three in number (A, B & C). They take over from the impulsive trends at the end of their span, in accordance with change in market trend, which could be either bearish or bullish.
They can be identified from their movement pattern, position and length. For example
Wave 1. Is the beginning of the trend movement as I have explained earlier.
Wave 2. Will regress, but not up to 100% of wave 1. The regression is as a result of some investors that soled off to take profit. However, if it does regress to 100% of wave 1, you start all over to recount.
Wave 3. Cannot be the shortest of the three impulsive waves (1, 3 and 5). It is usually the longest as a result of increased surge of investors.
Wave 4. Price will experience another regression because of some investors who could not wait. However, the regression cannot overlap or come close to wave 1 but if it does, you start all over again.
Wave 5. Here the late investors that has been observing the market all along, could not help than join to buy almost at the highest high of the price in order to grab something (FOMO based on the previous lecture). The excitement will not be long because, those that have invested from wave 1 or 2 having realized they have made lots of money will start selling off. Thus the price plunges into new trend of regression.
This new trend of regression is referred to as the Corrective Wave.
It is similar to that of impulsive wave but, in the opposite direction. Here, wave A and C are bearish and only B appears a little impulsive (bullish)
Note; I noticed that the Impulsive Wave consist of three actual impulsive waves (1, 3 & 5) and 2 corrective waves (2 & 4). Which are all in line with the trend.
What is your opinion about this theory? Why?
Personally, this theory is thorough and very technical and it is not easy to identify in the real world trading, just as the price is progressing.
This theory did not specify which of the trade to apply it on, is it hourly trade, daily, weekly, monthly or yearly. I might be wrong but, I feel that this theory will have a best time period to apply it on.
However, I can boldly say that it is a genuine strong guide only when you are able to accurately identify the very first wave.
In summery, it need to be thoroughly studied and understood before attempting to track it on the real live price trend.
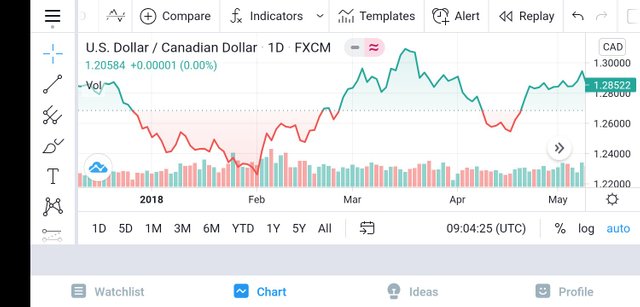
Choose a currency and on its chart, indicate where the full cycle of the impulse and correction waves is located. Explain in detail what you see. You must include screenshots and name which currency you are analyzing.
For this illustration I used USD/CAD price chart from the mobile Tradingview app.
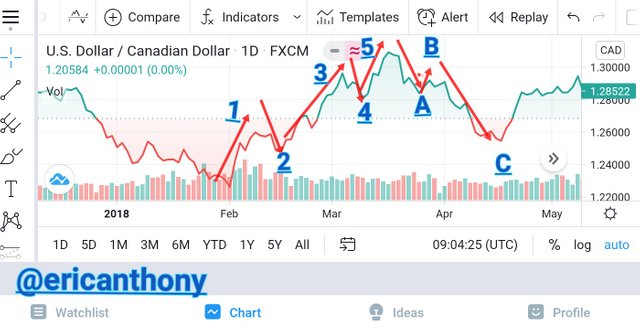
Here, I was able to locate the bullish first wave from February as it progressed, thereafter regressed at the second wave in the middle February, but not up to 10% of the first wave.
The third wave continued in it's bullish trend, which is longer than the first and subsequently the fifth wave and thereafter terminated at the middle of March, which is the 4th wave.
The fifth wave progressed towards the end of March but the uptrend was not sustained as it regressed bearishly as a sign of change in trend (the beginning of price Correction), that ushered in the A wave. Though the market tried to correct at the B wave, but no momentum, it regressed bearishly to C wave.
Elliott Wave Theory, though complex is worth studying. This theory seems to have the potential to make investors smart traders. I believe that when this theory is well understood, you will be in a better position to know when to apply it.
Thank you for being part of my lecture and completing the task!
My comments:
Your answers were ok, although you could have deepen them a bit more. As well as that, the pattern was correctly addresses! Good job!
Overall score:
5/10
Thanks Professor @fendit. You have really done me a great favor. This is the first assignment I have passed this week. This week has been tough. I can't tell why. God bless you... 5/10 looks poor but it's far better than 4.5. I'm really grateful.