Elliott Wave Theory and its application || My Homework || Steemit Crypto Academy - Season 2, Week 6
Intro
In this homework task I am going to share my learning of Elliott wave theory And how to apply it in trading. I am thankful to steem crypto academy Professor @fendit Very much for coming up with this noise theory which was very much unknown to me and after this learning I can easily understand that this theory is very much important for the traders and I hope applying this theory anyone can make profit and incur less loss. So I am going to share whatever I have learnt about this theory and how can I easily apply it in any cryptocurrency for gaining profit.
About Elliott's Theory
Ralph Nelson Elliott Is obviously a great analyst because he have gathered the trading data of 75 years and after that he had written a book where he has explained The wave principles.
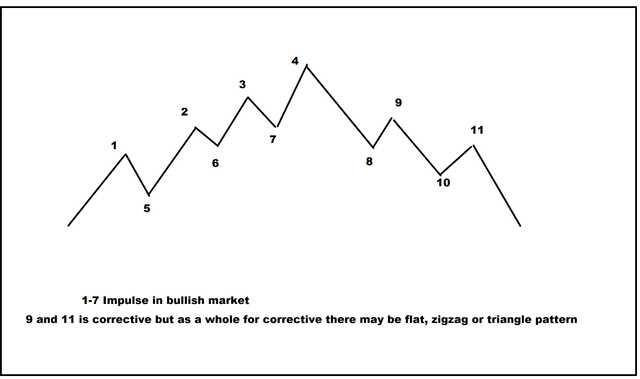
Before going to the theory I just want to explain in short about the theory. This theory indicate some pattern of historical data of the currency. It can follow the pattern like the following picture. So when it is following such kind of zigzag like ups and down pattern then it is included in this theory. In zigzag formation when it is following the overall trend of the market then it is called impulse waves. And when this kind of formation does not follow to the overall market then it is called corrective wave. And in corrective wave there may be at least three pattern zigzag, flats and Triangle.
1 What's the application of this theory?
This theory is applicable in trading because it is helpful for trading as market always have such kind of trend. It is matter of understanding the pattern then we can easily understand when to buy and when to sell when anyone have complete idea about this pattern and theory.
In the above picture 1, 2, 3, 4 are the position when to buy but upto 5, 6, 7 are the position when to sell. When its bearing trend, our common strategy is to sell and when its bullish trend, then to buy. Its simple and basic strategy. But out of this two situation we can easily get the impulse or corrective trend. So, this can help us to take decision to avoid greater loss. Following this we can have focus on profit as we know that first point of impulse is not as sharper as second one. As in overall, its following a zigzag like impulse pattern, then its really understandable that price in this cycle of patter will not go down to the level when its started.
So, in this case decision making will be more easy, i must say. This patterns are very common and always follow in the market and if you can see such kind of pattern, you can easily understand these two waves from pattern in the market and if you can just rectify the points of impulse web then you can easily understand when to buy.
2 What are impulse and corrective waves? How can you easily spot the different waves?
As I have explain it earlier that home the overall pattern goals would the market pattern then it is impulse wave when against then it is collective. So you can see is easily from the chat when it is impulse as I have explained earlier.
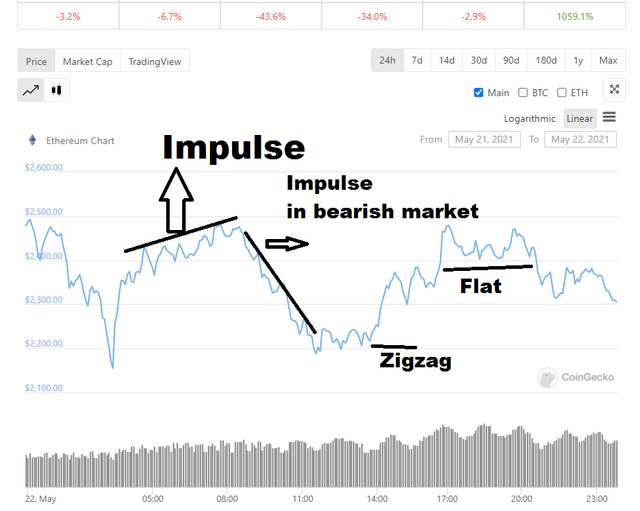
Impulse wave is easy to understand as its following overall market pattern whether its bullish or bearish. But in case of market opposite pattern, like corrective pattern, there are also some points which are following the overall pattern. So, in this case corrective pattern you will find at least three waves. Flat when its up and down at almost similar rate. Zigzag when the uptrend is long jump than downtrend in the picture above. Finally, Triangle when its exactly not following any and not easy to interpret.
3. What are my thought on this theory? Why?
In the chat I have used the ethereum data of last 24 hours from coingecko.com. So I have just picked a single currency and I have found this kind of pattern of last 24 hours that are so you can easily understand how frequent this is happening in the market. So when you just understand this pattern so I hope you will have to include less loss because this pattern continuous over times and many times. So I have come to know ever interesting idea which we can easily apply frequently while trading and I am thankful to to professor and Elliott Also for such a good understanding.
Conclusion
If you can learn from such kind of interesting way then hopefully will be a good trader and I am very much thankful to the steem crypto academy for arranging such a program which is physically improving our knowledge with such kind of explanation and lectures.


Who I am

Upvote, Resteem and Follow me on steemit @engrsayful
This is Saiful’s Classroom from @engrsayful
Find me on
| Youtube | ThreeSpeak | DTube |
Thank you for being part of my lecture and completing the task!
My comments:
The most important thing about this task was the pattern in the chart... and you didn't include it. There was no analysis either, which makes your work pretty incomplete.
Overall score:
3/10
You've got a free upvote from witness fuli.
Peace & Love!