Steemit Crypto Academy Season 3-Week 1 | Trading Crypto With Ichimoku-kinko-hyo Indicator - Part 1 @by endersontowers
Source
Happily starting the third season and happy to continue amplifying my knowledge on the cryptographic subject, I love that there are people @kouba01 who express their knowledge so many of us can learn and launch all the content as well as continue to share that knowledge with others who require it. , then I will perform the first task after reading the lecture. I hope you have a very good reading, thank you.
1- What is the Ichimoku Kinko Hyo indicator? What are the different lines that make it up? (screenshots required)
What is the Ichimoku Kinko Hyo indicator?
The Ichimoku indicator was developed by a journalist of Japanese origin Goichi Hosoda, in the 1930s, during 20 years of essays on the rice market, he observed that in certain parts of the graph changes were observed that became common and it was helped with a deep analysis in the shortest possible time, several times they helped him make decisions for the purchase and sale of rice in a short period, Goichi Hosoda put his method into operation for 20 years and then wrote a book about the indicator, this then this indicator is Commonly used in Japan and much of Asia, for the market of many commodity products and especially the financial market, this indicator particularly allows us to check the market trend, support and resistance levels so that we can make a quick decision and sure of when to buy and sell an asset, according to my research it is advisable to read the chart for days or weeks.
What are the different lines that make it up?
There are 5 lines for its composition.
* Tenkan-Sen "conversion line".
It is the "blue" line that particularly follows the trend and is linked to the midpoint of 9 candles on the chart, this is calculated by adding the highest price and the lowest price and dividing it by 2.
Source
* Kijun-Sen "reference line".
"White" line, It is the midpoint of 26 candles. It is calculated by adding the highest price and the lowest price and dividing by 2.
Source
* Senkou Span A “phase gap”.
“Yellow line” It is the midpoint of the price on the last 26 candles, it is calculated through the closing of the old trend and the beginning of 26 candles of the new trend to perform the calculation due on the new trend.
Source
* Senkou Span B “landing leg”.
“Red line” It is the midpoint of the tenkan line and the kijun line within 26 candles.
Source
* The Chikou Span “lagged section”.
"Green line" It is the intermediate line on 52 candles, these will throw us an intermediate price on 26 candles, these last two lines commonly form a cloud on the chart. Where it will tell us where the trend is.
Source
2- How to add the Ichimoku indicator to the chart? What are its default settings? And should it be changed or not?(screenshots required)
How to add the Ichimoku indicator to the chart?
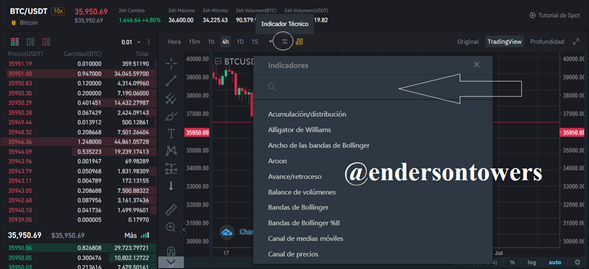
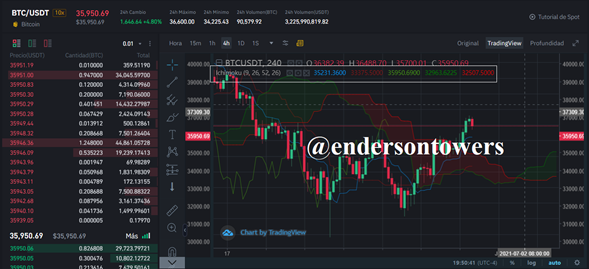
We go to our Exchange, in my case binance and enter our preferred pair, in my case BTC / USDT, we go to the indicator search bar and look for our indicator.
Source
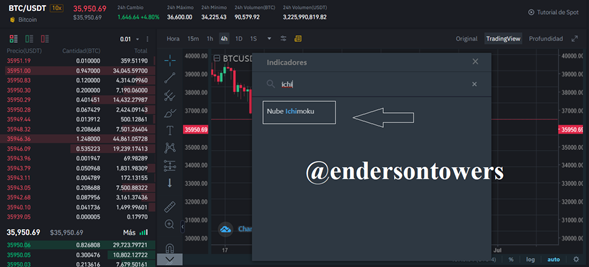
We write ichimoku and our indicator will appear directly and we click on its name.
Source
With this we will have our indicator installed in our diagram.
Source
What are its default settings?
We go to the settings of our indicator and click it.
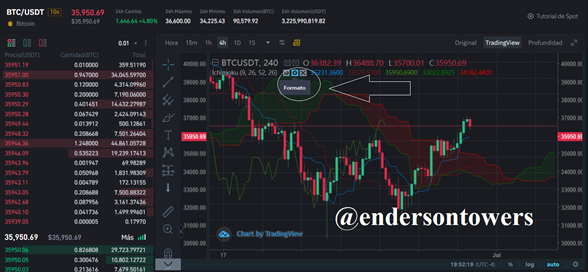
Source
We can observe that we can change the data of the timelines to have a reading according to our purpose.
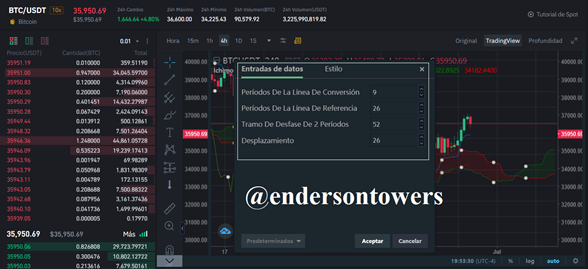
Source
It also allows us to change the style of the lines, their color and their thickness. To quickly differentiate them.
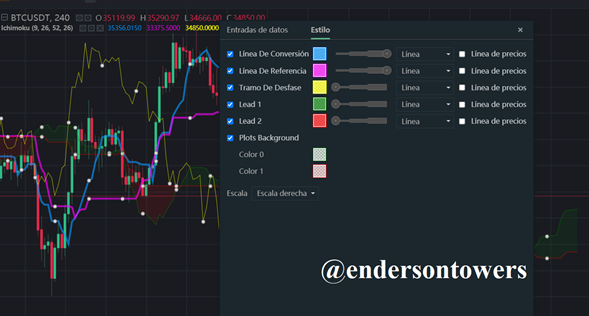
Source
And should it be changed or not?
It is advisable to change the values according to the market in which one works since it works according to working hours between days and weeks and not all markets have the same working day, as it has been said in the teacher's conference, among the most popular values (10, 30, 60) or (20, 60, 120) are found, but it all depends on the asset market for which the reading is being made.
3- How to use the Tenkan Sen line? How to use the Kijun Sen line? And How to use them simultaneously?(screenshots required)
How to use the Tenkan Sen line?
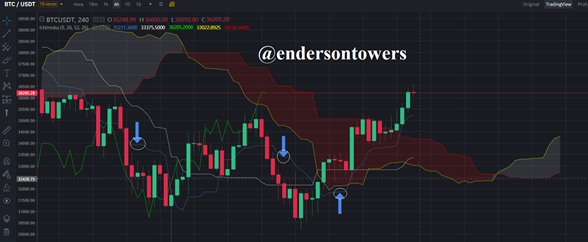
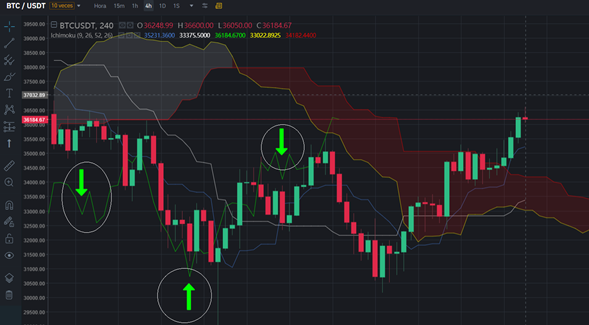
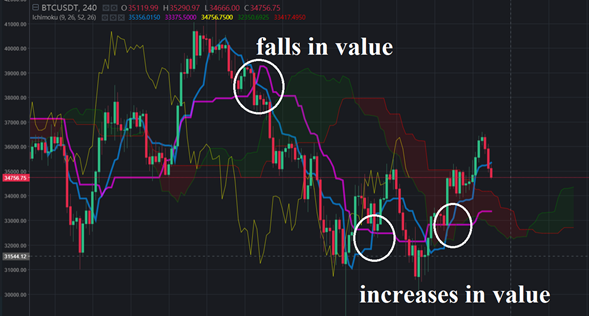
This line is designed to show the movement with respect to the price of the cryptoactive during the configuration carried out, in my case it would be a period of 9, to know how to use this line is very simple, if we see the tenkan sen line above the line kijun sen, means that we must buy since the price will rise, in the same way if we see the tenkan sen line below the kijun sen line, it reflects that we must sell since the price will fall.
How to use the Kijun Sen line?
The kijun sen line defines the price momentum for a range of 26 periods, if the price is above the kijun sen line it means that it is prone to increase, and if it is below the kijun sen line, it means that the price will go down, this line depends on the tenkan sen line, to determine the force of the movement.
Source
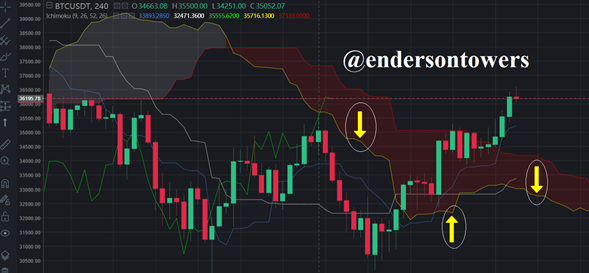
And How to use them simultaneously?
The tenkan sen and kijun sen lines are used together to generate commercial signals that allow a better performance in making decisions about an investment, since one line depends on the other to generate a useful result when reading the graph. If the tenkan sen line goes below the kijun sen line, this means that the price will fall, and if the kijun sen line crosses the tenkan sen line above, it means that it is a strong upward signal.
4- What is the chikou span line? And how to use it? And Why is it often neglected? (screenshots required)
What is the chikou span line?
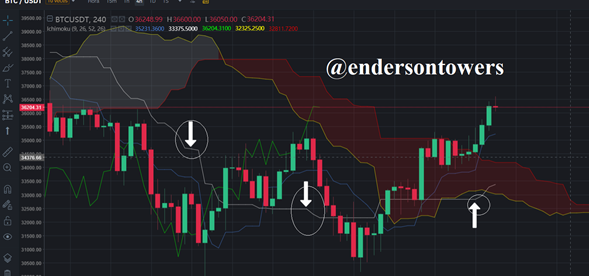
It is a line that is known as the moving line in relation to the conversion line, it is linked for its reading through the projection of 26 periods after the closing of the price. This means after reading past trends and current trends.
And how to use it?
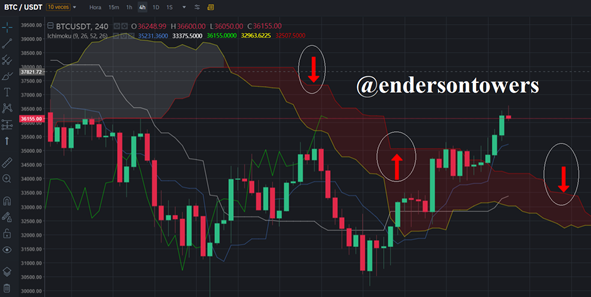
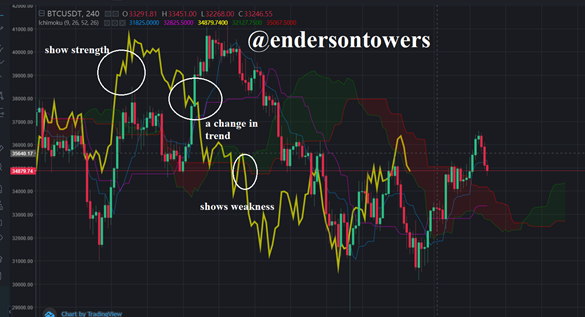
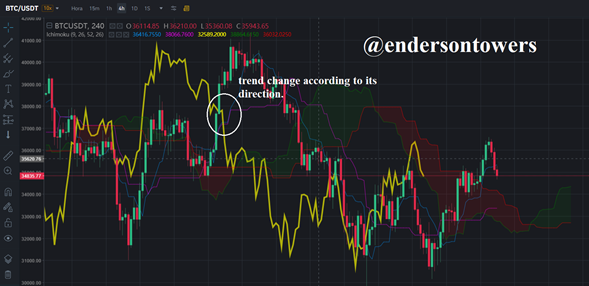
This particular line is used to visualize the present price in relation to the past price of the periods, if the price is above the chikou span line it means that it has less force in relation to the price, if the line is below of the chikou span line, it means that the price has the strength to increase, another very important point to limit, is that if the chikou span line goes through the candles, this means that the trend will change according to its direction.
Source
And Why is it often neglected?
The chikou span line allows us to know a price margin which, based on past readings and recent readings after the last closing of 26 periods, in the same way we cannot be governed by its veracity in the prediction of a trend or price through this line already that on many occasions its prediction is not fulfilled because it makes false signals.
Source
5- What's the best time frame to use Ichimoku? And what is the best indicator to use with it? (screenshots required)
What's the best time frame to use Ichimoku?
This indicator can be used in any period of time, everything depends on the comfort of use that we carry out the reading, and above all what type of operation we are carrying out, for long operations it is advisable to place the type of reading of 4 hours, and for short operations , It is recommended that it be in short periods, from 30 minutes to 1 hour.
And what is the best indicator to use with it?
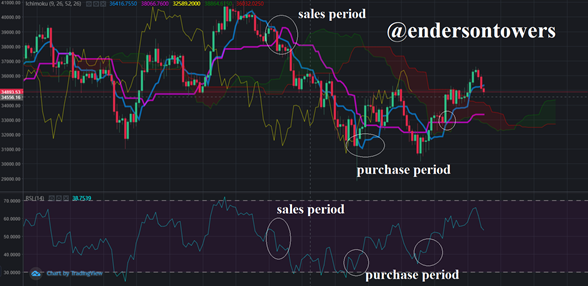
Last season I had the opportunity to know the RSI indicator through his conference and above all I started it because I did not know it, for me it is one of the best indicators that exist, and if we combine other types of indicators such as the ichimoku as we will have a better reading for both the buy and sell price and readings on trends and resistance of bullish and bearish price is a very good combination.
Source
6. Conclusión:
I loved the idea of making ourselves known indicators that we can use in our investments, especially that it allows us to combine our learning and be able to make our own personal conclusion, either by joining different indicators such as the RSI with the Ichimoku since this indicator It allows us to take good readings, but we always have to be careful with false signals, and above all to make a good reading since many times it is a bit confusing due to the multiple lines, so we have to familiarize ourselves well. I congratulate the teacher, the topic was very good. Greetings!
Dear @endersontowers
Thank you for participating in Steemit Crypto Academy Season 03 and making efforts to complete the homework task. You got 9/10 Grade Points according to the following Scale;
Key Notes:
We appreciate your efforts in Crypto Academy and look forward to your next homework tasks.
Regards
@cryptokraze
Good morning teacher @cryptokraze , thank you very much for the credits, a pleasure for me to expand my knowledge with these great topics, I will continue doing my best as I have always done, greetings dear friend.
congratulations on this new season as a teacher, I know you will do an excellent job, greetings friend