Steemit Crypto Academy Season 2-Week6 | Cryptocurrency Trading with MACD indicator. By @endersontowers

Source
After reading the teacher's lecture, which was very interesting, I will put my knowledge generated in reading and research by third parties to the test, it is a very interesting topic, then my task on the MACD indicator.
1-What is the MACD indicator simply? Is the MACD Indicator Good for Trading Cryptocurrencies? Which is better, MACD or RSI?.
What is the MACD indicator simply?
The MACD indicator is an instrument used to predict the directions of trends that may exist in a cycle of a candlestick diagram, these directions of the candles are measured according to the reading of the lines that form divergence and convergence with respect to line 0, this allows us to predict the course of the trend and through this our entry and exit from cryptocurrency trading or the stock market, this indicator draws a moving average by studying the technical analysis history of an asset, This allows us to get a lot of information regarding possible and future trend lines that are approaching either bullish or bearish.
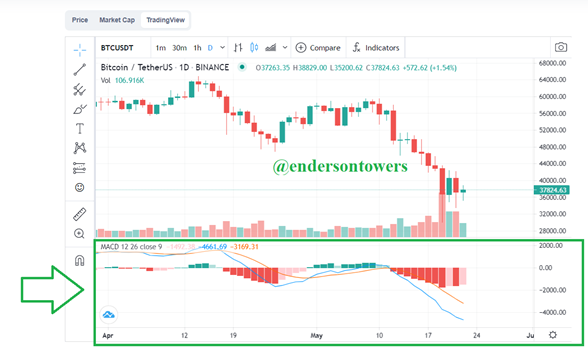
As we can see, we enter the candlestick diagram of the BTC-USDT pair, through the CoinmarketCap indicators page, in the same way that we carry out the procedure of how to install the RSI, do it this time, we are going to trading view, indicators, and we write “MACD”, and it automatically throws us the MACD indicator as we appreciate it in the lower part of the diagram below.
Source
Once in the MACD indicator, we can go to its configuration to know the elements that make it up, both the reading elements and the meaning of each MACD line, SIGNAL, and how the histogram of the bullish and bearish candles is formed.
Source
Green line:
represents the histogram which allows us to graphically see the waves and the cycle of the candles to differentiate a divergence or a convergence through the history of the past market.
Blue Line:
Represents the MACD line, which allows us to differentiate the market trend either bullish or bearish by subtracting two exponential moving averages "Ema" that allow us to know a possible price forecast.
Orange Line:
Represents the Signal line, which is a 9-cycle Ema line that works in conjunction with the MACD line.
Is the MACD Indicator Good for Trading Cryptocurrencies?
It is very good at predicting the fluctuations in the price of cryptocurrencies since it allows us to know how the bull and bear market behaves through signal lines and MACD lines, it is used in almost the same proportion as the RSI indicator but the reading is in the same way. different, the MACD indicator, allows us an approximate where to buy and where to sell our cryptocurrencies since it studies the divergences and convergence of the market.
Which is better, MACD or RSI?
Both are very good because it allows us to know an approximate of a momentary price forecast and the approximate point of purchase and sale of a cryptocurrency, I think it depends on the skill and our strategy to make a choice, but remember that both give us values approximate and may be wrong at a certain moment and change orientation quickly leaving us perplexed, both the RSI and MACD method are methods that allow us to know an approximate of how the future trend will behave through the past history of the market, just enough to do a good read and I think both are very useful.
2-How to add the MACD indicator to the chart, what are its settings, and ways to benefit from them? (Screenshot required).
To add the MACD indicator to the chart, in my case I did it through the CoinMarketCap indicator.
As a first step we go to the CoinMarketCap indicator, then we choose any pair, in my case I chose BTC-USDT, and we click on Tradingview.
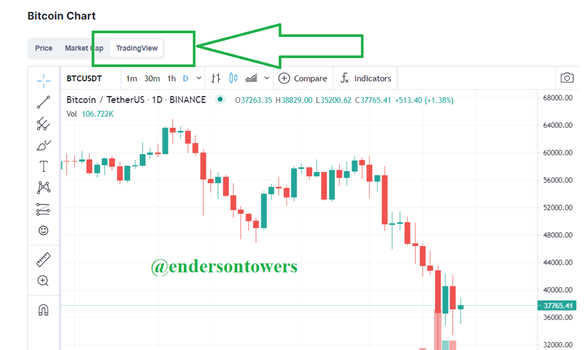
Source
Next we go to the option of "indicators", and we write our indicator "MACD" and we click on it.
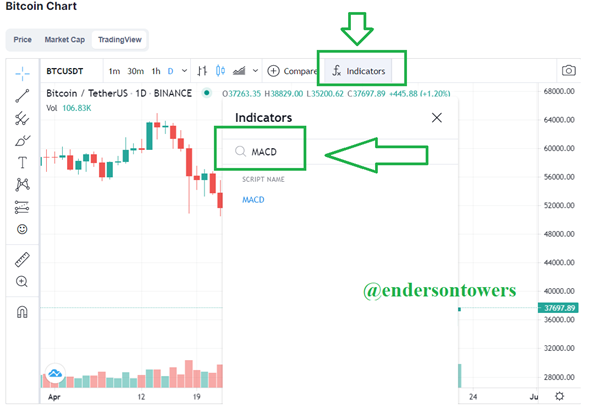
Source
At this point we will have our MACD indicator installed at the bottom of our diagram.
Source
Now we will proceed to configure it in the following way, we click on the configuration icon as mentioned in the image.
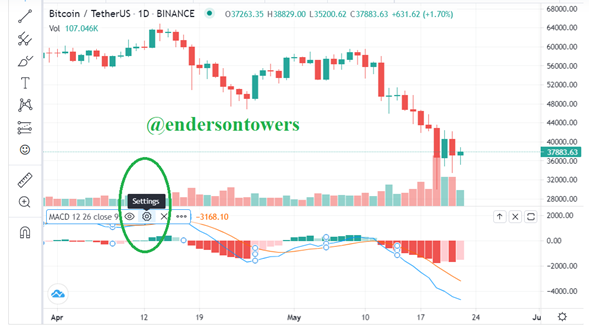
Source
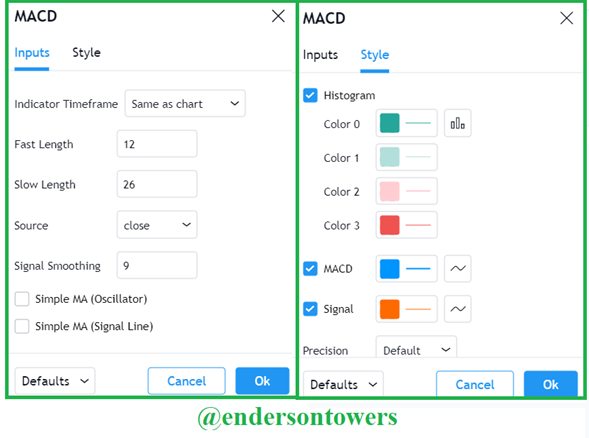
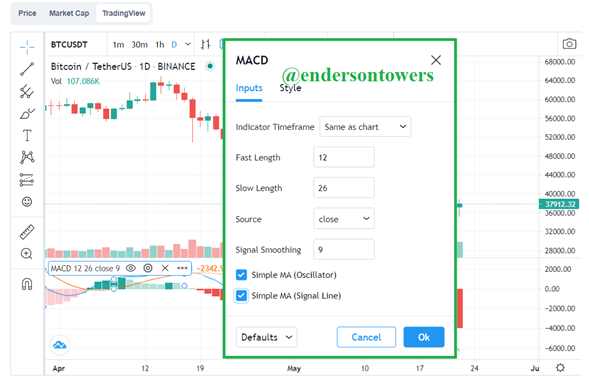
We will get a window which will show us a series of data that we can change in relation to the types of data inputs and on the visualization style that we feel more comfortable to read the diagrams.
Indicator timeframe:
in this option we can choose the reading range of our diagram, either 1min, 1 hour, 1 day, 1 week, 1 month, etc.
Fast length:
here the system gives us by default 12, which means the length of the fast EMA.
Slow lenght:
the system defines by default 26, for the long EMA.
Source:
is the type of closing that the system determines, it can be the closing price, the opening price, etc.
Signal smoothing:
determines the signal line usually is in reading type of 9.
Source
In styles we can appreciate a wide variety of colors to differentiate each element that makes up the MACD marker, according to our convenience we will put the color we want.
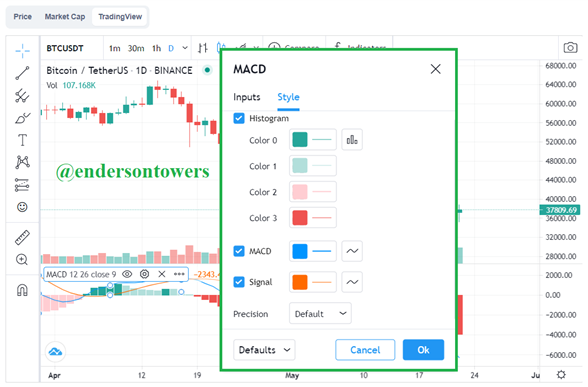
Source
I think that the faster the result is read in short periods, it is much more beneficial to take the correct reading of this indicator, since it can give us unsuccessful results and therefore we have to be very attentive to any misreading.
3-How to use MACD with crossing MACD line and signal line? And How to use the MACD with the crossing of the zero line?.
There are two types of entanglement.
Case 1:
When the MACD line passes above the signal line from top to bottom, this predicts that the price of the cryptocurrency will fall.
Case 2:
When the MACD line goes below the upward signal line, it predicts that the value of the cryptocurrency will rise.
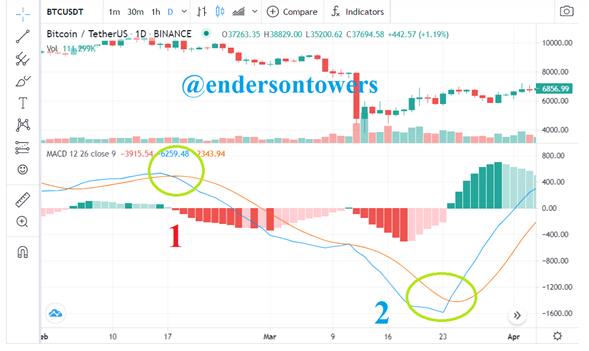
Source
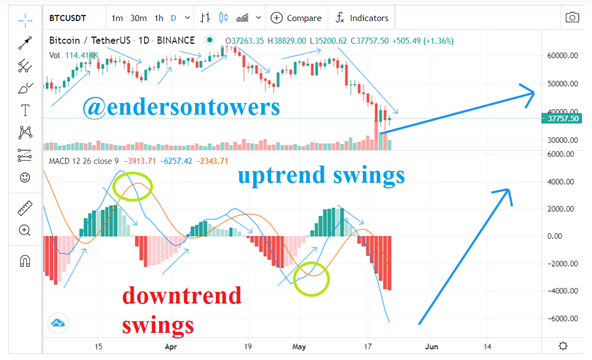
When the MACD lines fluctuate above the 0 line, it means that the prices will fluctuate in an uptrend, while if the MACD lines fluctuate below the 0 line, the values will tend to be in a downtrend.
Source
4-How to detect a trend using the MACD? And how to filter out false signals? (Screenshot required).
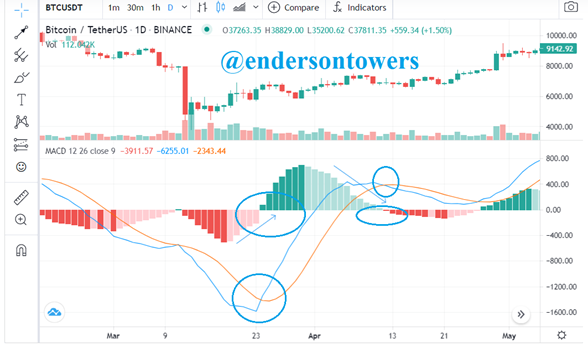
We detect a trend by means of patterns in the volume of candles on the chart, and by means of the position of the MACD line, and the signal line, and we can also predict the future trend with respect to the oscillations of the MACD lines, and signal in relation to line 0 of our diagram as we see in the following image.
Source
how to filter out false signals?
It is almost impossible to filter false signals since the market is too volatile and can change at any time, but I have visualized that when they give false signals many times the MACD line and signal oscillate with very changing volume, either considerably increasing their volume or decreasing their volume, but many times to avoid false signals, my recommendation is not to invest all our money at the first signal, but it is more advisable to do it in short parts.
Source
5-How can the MACD indicator be used to extract points or support and resistance levels on the chart? Use an example to explain the strategy. (Screenshot required).
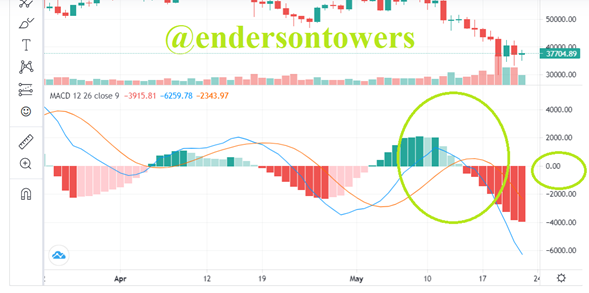
The strategy that I have used to extract the points of support levels is when the MACD line begins to change its trend and the Signal line approaches it, intercepting it and following the same trend as the MACD line, through this it creates a pattern of consecutive resistances whenever it performs this action.
Source
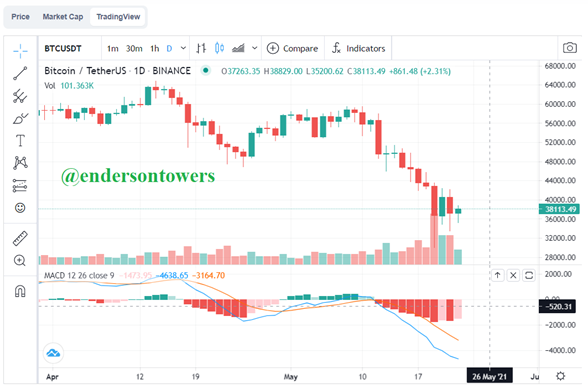
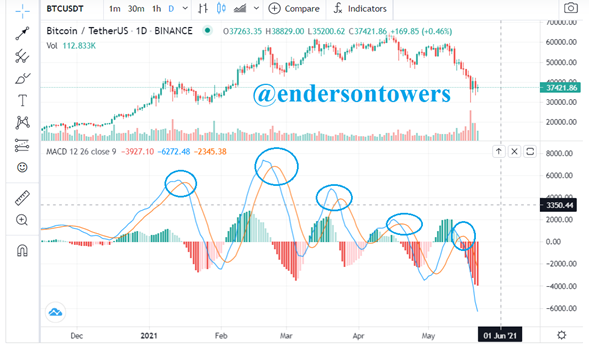
6-Review the chart of any pair and present the various signals from the MACD. (Screenshot required).
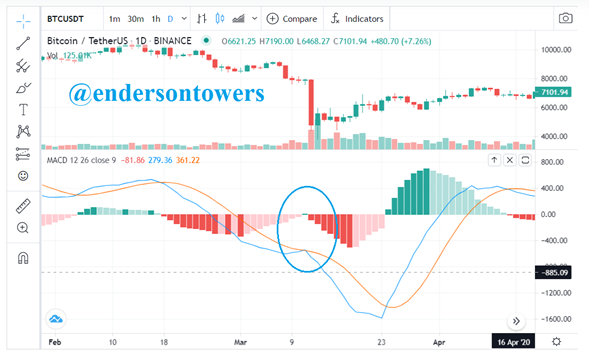
As we can see here we see the divergences and convergence in relation to the history of the BTC-USDT pair, as we can see, there is an oscillating pattern between the signal lines and the MACD line on the positive side of the 0 line, which gives us that it had a weak oscillating inclination to the upside since its low purchase volume did not allow the price of BTC to increase, on the other side of line 0 in a negative way we see more inclination of sale volume, which we see stronger patterns of bearish convergence that have been formed previously, this will cause the BTC to continue to fall, but little by little it is forming a positive pattern of bullish resistance that will soon break to the upside.
Source
Conclusión.
The MACD indicator is a very good choice to interpret the possible provision of a price since it focuses on reading the MACD line and signal line, which with respect to line 0 we can deduce the path of the price of the cryptocurrency, in a way of divergences or convergences that can be bullish or low depending on the case that arises, but the reality is that it is an excellent indicator to work in trading, besides that one has to work very well according to our strategies, and take very good advantage of it , I congratulate professor @kouba01, for this great subject which I did not have very good knowledge of, it will serve for my future investments, thank you very much.
CC
@kouba01
@steemitblog
@steemcurator01
@steemcurator02
@yohan2on
Hi @endersontowers
Thanks for your participation in the Steemit Crypto Academy
Feedback
This is good work. Well done with your research study on the MACD trading indicator.
Homework task
8
Thank you very much teacher, you are a great teacher, your knowledge has helped us a lot in learning to trade, thank you very much for sharing your knowledge. regards!