Steemit Crypto Academy Season 2-Week4 | Cryptocurrency Trading with RSI. by @endersontowers

Source
For me it is an honor again to be in his class @kouba01, I always end up learning something new, he is doing a very good job in the crypto-academy, his lecture was excellent, welcome everyone, today I present my homework on the RSI indicator. Have a very good reading and a very happy day. Greetings!.
What is the Relative Strength Index - RSI and How is it Calculated?
Source
What is the Relative Strength Index – RSI
The Relative Strength Index (SRI) designed more than 40 years ago by technical analyst Willis Wilder, refers to automatic technical analysis using a candlestick chart indicator, to forecast future prices for a range of time or length, This type of indicator is commonly used mostly by large and small investors who wish to have one more variable for their convenience and thus have a more solid base to invest in due time, since this indicator stores information about the cryptocurrency we wish to invest. and assumes through its history in time and the value of the coin, the highest points that the coin has reached and the lowest points that it has reached based on the time it has taken to reach these points, this type of indicator predicts or referenced by its algorithm (formula), which gives you the lowest point where you should buy and the highest point where you should sell to wait for its respective correction and perform the same procedure. Remember that it is a tool, it is not a crystal ball. The market is sometimes unpredictable.
Source
How is it Calculated?
It is calculated by the formula.
RSI = 100 - 100 / (1 + RS)
Where "RS" are average gains during a certain period of time / the average loss during a certain period of time.
This means that this indicator calculates the average value of the price of a token through the variation and oscillations that it performs for a certain time or length, these variations of time or space of length, and then by itself it takes its percentage through the formula before described, by default the SRI always has a default length of 14, this means if we see a 1-day chart, the RSI will perform it for the last 14 days and will take an average value from 0 to 100, where the value from 0 to 30 is the overselling price and 50 to 70 is the overselling price.
Can we trust the RSI on cryptocurrency trading and why?
This indicator has been on the market for 40 years and many investors take it as a reinforcement for their investments, since many of them know about this indicator and have their strategies based on their experience with this type of indicator, of course for someone who does not have Experience will be a headache to start, and many times you will have to lose to gain experience, my advice is not to trust all your investment to an indicator since many times it can be a double-edged sword and if you do not know how to handle it well you can go wrong , it is best to go little by little and carry out your own technical analysis, and reinforce it using these types of tools to amplify the results. Always having total calm in decision making.
How do you configure the RSI indicator on the chart and what does the length parameter mean? Why is it equal to 14 by default? Can we change it? (Screen capture required)
The first thing we must do is look for the website of your choice which performs cryptocurrency analysis and shows you indicators and graphs, in my case use "CoinMarketCap". And use the cryptocurrency "BitCoin".
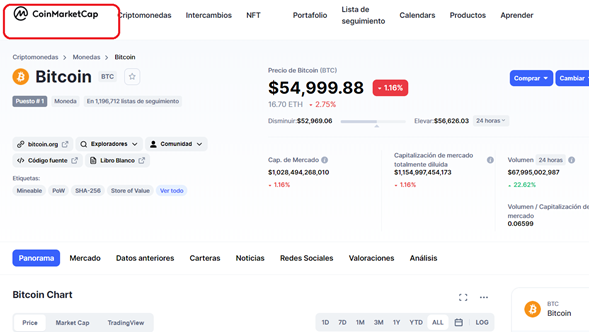
Source
Next we select the option "TradingView".
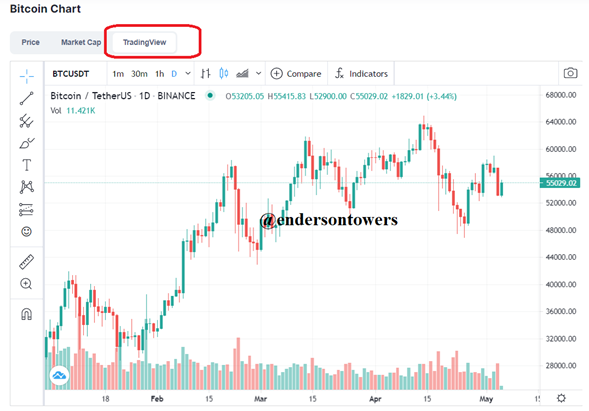
Source
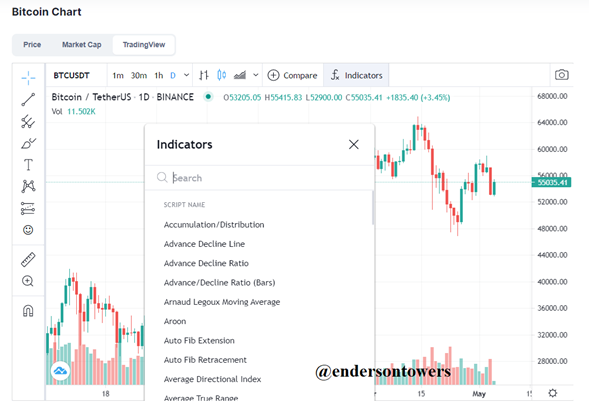
Then we will have to select the "Indicators" box, which will show us a search bar.
Source
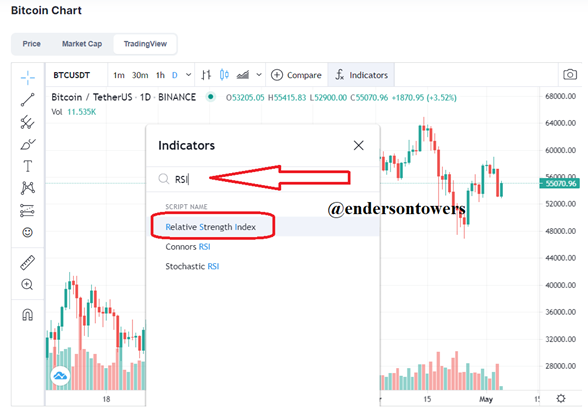
In this search bar, we will search for the word "RSI" to find our indicator, and select the option "Relative Strength Index".
Source
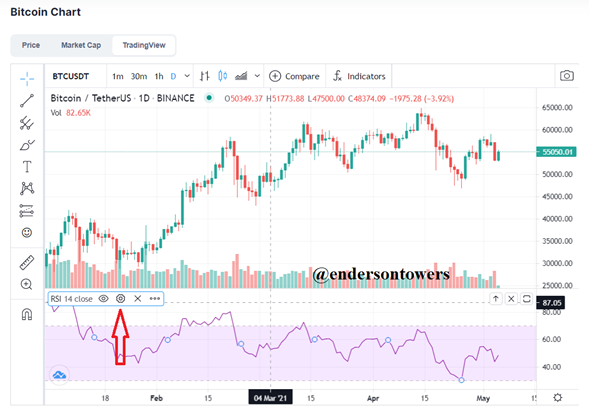
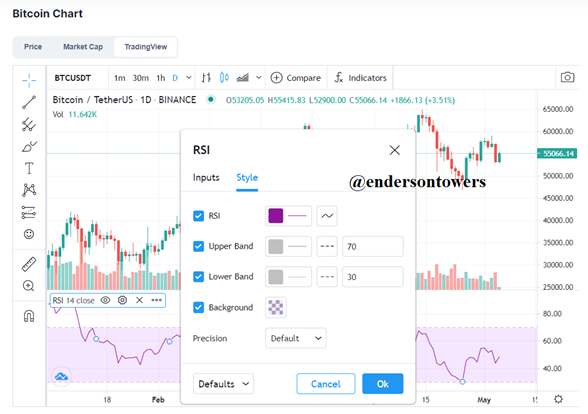
Our configuration is almost ready, as we can see above the red arrow we have the option "configure", just in case we want to configure our RSI indicator.
Source
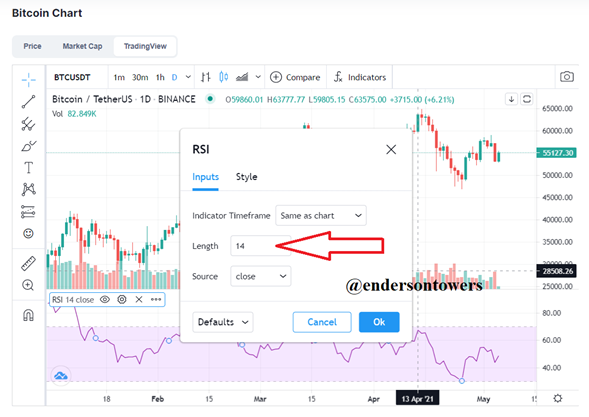
It gives us two options, one is "Inputs" where we can configure the length of our indicator that by default gives us 14 and is the most advisable, but it all depends on your strategy and how you adapt.
Source
And we have the option "Style" where we can configure the trend lines, resistances, supports, everything related to the chart.
Source
Following all the steps described above we can see the RSI indicator configured and ready to be used.
Source
Why is it equal to 14 by default?
Its creator Wilder, recommended this figure based on the smoothed period of the weighted moving average of 14 cycles. This allows you to measure the price variation over 14 periods with respect to time or length in a decreasing exponential way but never reaching zero, in short it measures the variation of the value in a technical analysis using candlestick diagrams.
Can we change it?
If it can be changed, since this depends on the taste of the person and your trading strategy, it is adaptable to your comfort, remember that this strategy is to buy and sell at appropriate times and each trade has its perspective of seeing things.
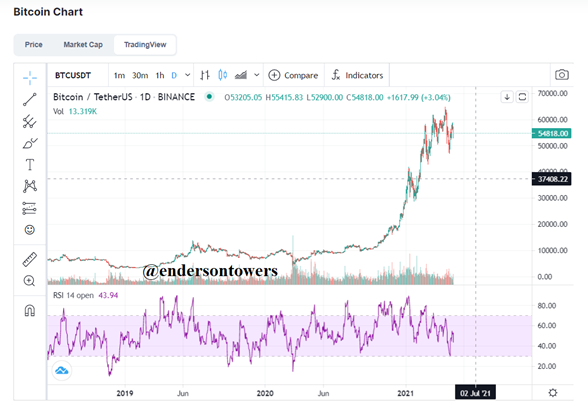
Here we have an example of the length parameter of 14. As we can see, the parameter is very easy to understand, especially because it gives a very clean diagram, between bullish and bearish trends, something very easy to understand.
Source
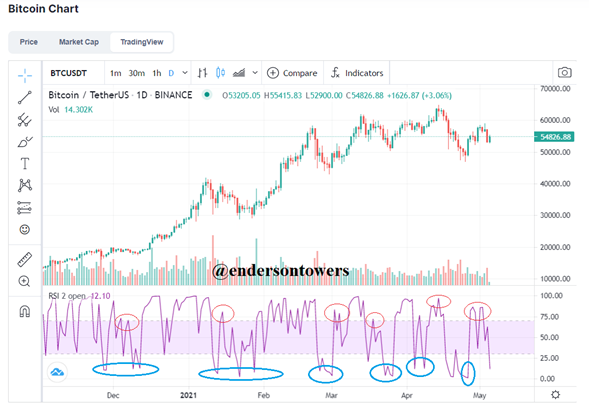
Here we have an example of the length parameter of 2. Here we see that the parameter is a bit complex to understand, especially because it gives a very distorted diagram, between bullish and bearish trends and to make decisions we must analyze very well since it takes the results hastily and the result we want may change unexpectedly.
Source
How do you interpret the overbought and oversold signals when trading cryptocurrencies? (Screen capture required).
Overbought:
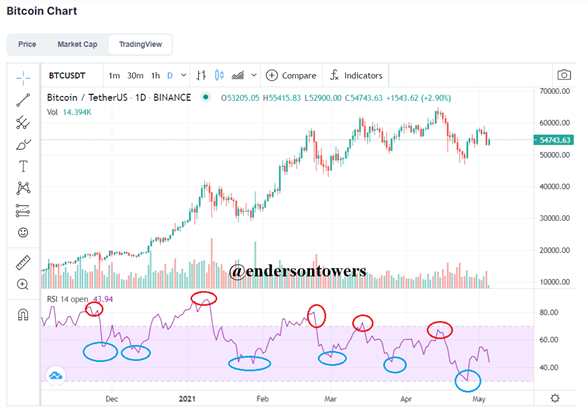
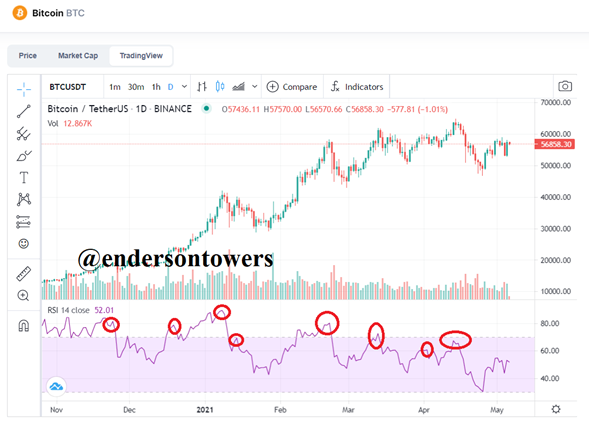
We consider that the RSI indicator works by intervals of 14 in length or time, and by variation of rise and fall in the prices of the cryptocurrency, to interpret the signals of overbought we have to observe the RSI indicator through technical analysis and see the points that are above 70 (red circles in the image), these points are higher than the middle line of 50, it means that it has very little margin of profit or loss of profit, since when the market makes the correction, prices always have to be regulated and corrected.
Source
Overselling:
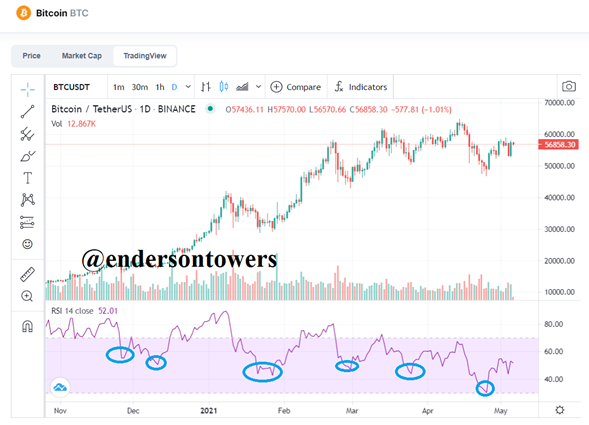
The oversold signals are given after making a high purchase and the low value or making a low purchase and the indicator went up and I waited a long time to sell and when it started to fall it reached a point where the profits were very little or were lost, this point is below 30 on the RSI diagram, as seen in technical analysis (blue circles in the image).
Source
As a curious fact, I must comment that you have to be very careful with the indicators, since due to a small distraction we can lose a large movement, we can leave open orders if we have carried out a good price forecast analysis and we know how much to vary. or swing the market to make a good buy below 30 and sell above 70 of the RSI indicator.
How do we filter RSI signals to distinguish and recognize true signals from false signals. (Screen capture required)
False signals of bearish divergence
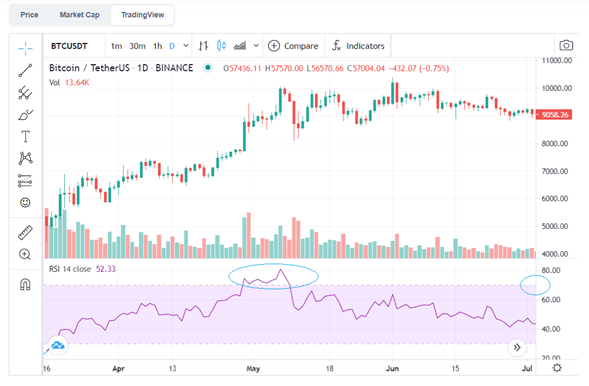
To distinguish true and false signals in the RSI indicator, we will have to know and have knowledge about the technical analysis of a candlestick diagram, in addition to this we say that a false signal of bearish divergence is when it is above 70 and is missing line of descent but it does not go below 70, it goes down just a little and goes up more.
Source
False signals of bullish divergence.
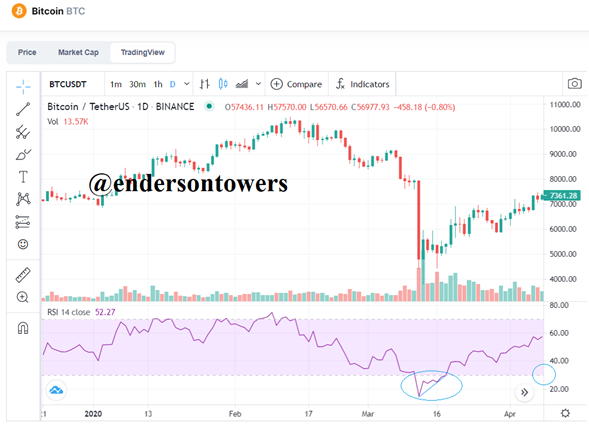
The false signals of bullish divergence as we can see is when the line is below 30 and tries to go up a little but does not exceed 30, here we tell you that I do a bullish divergence lack.
Source
Review the chart of any pair (eg TRX / USD) and present the various signals from the RSI. (Screen capture required)
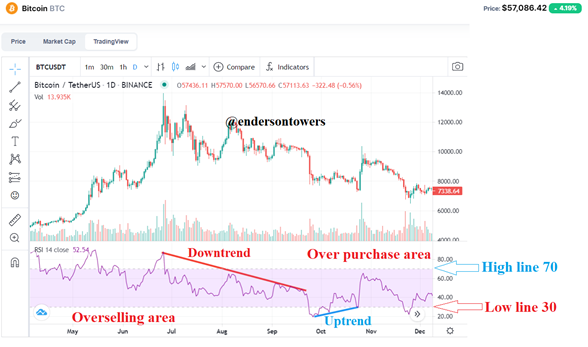
BTC-USDT “1D” chart, different signals from the RSI indicator.
Source
Conclusion :
The RSI indicator is a very useful tool for professional trading and training trading.There are many free pages where you can start to try it and learn less about it for free with certain small limitations, but there are also pages that charge a monthly fee for the use of this RSI indicator. , this tool is essential although it is not a crystal ball where we can see the future, it is advisable to start with little investment and amplify while gaining experience, remember that we have to be careful with overbought and oversold points, we have to carry out a technical analysis and always having our strategy and following it to the letter. I really liked his class, the truth is, I learned a lot and left a very good teaching.
Cc:-
@kouba01
@steemitblog
@steemcurator01
@steemcurator02
@yohan2on
Hello @davosimple,
Thank you for participating in the 4th Week Crypto Course in its second season and for your efforts to complete the suggested tasks, you deserve an 8/10 rating, according to the following scale:
My review :
A well-content article accurately demonstrating your understanding of the questions. For the last question, you had to add an analytical paragraph to highlight the various signals and give your own conclusion.
Thanks again for your effort, and we look forward to reading your next work.
Sincerely,@kouba01
Thank you very much, I did the best I could, I learned a lot about the subject, I have a question, at the beginning of the correction, you did not put my user "endersontowers", but you put "davosimple" which is another user, there is no problem in that? .