Crypto Academy Season 03 - Week 04 | Advanced Course - Trading The Dynamic Support & Resistance. By @endersontowers

Source
I have read your excellent lecture and I want to congratulate you on such a valuable topic, it was very clear and straight to the point, I congratulate again professor @cryptokraze for implementing this type of valuable topics that provide a great teaching that we will use for our life as traders, I thank you very much , then I present my task, welcome.

1 - What do you understand about the Concept of Dynamic Support and Resistance? Give Chart Examples from Crypto Assets. (Clear Charts Needed)
We know that to measure a point of resistance and support we must do it through a technical analysis so that we must make the reading according to the lower and upper limit points that the value of the cryptocurrency evaluated horizontally has reached, These are formed either by the great demand in sales or the great demand in purchases, where the price often rebounds from those points to return its value and often exceeds those points to reach a new point of support or resistance.
Now I can mention that the dynamic support is carried out by means of a technical analysis in charts, which we must take into account the market trend, whether bullish or bearish, this measurement is carried out in an inclined or diagonal way according to the market trend, where we will take into account the lower lower levels in the case of dynamic support and where we can take into account the highest points of the upper levels in the case of dynamic resistance, moving average lines are commonly used to make a better reading, both dynamic resistance and dynamic support.
Next I will make two brief examples of how we should read both.
Example of dynamic resistance on a graph.
Through the technical analysis of the XRP / USDT diagram, with a time frame of 1 hour, choose to place the exponential middle line "EMA" with a length range of 50, as we can see in the diagram, at the selected points the EMA line 50, acts as a resistance line which when the value reaches that point, tends to bounce in the opposite direction downwards, the EMA line tends to follow the price, for this sense it is known as a dynamic line.

Source
Example of dynamic support on a chart.
Through the technical analysis of the XRP / USDT diagram, with a time frame of 1 hour, choose to place the exponential middle line "EMA" with a length range of 50, as we can see in the diagram, at the selected points the EMA line 50, acts as a support line which when the value reaches that point, tends to bounce in the opposite direction upwards, the EMA line tends to follow the price, for this sense it is known as a dynamic line.

Source
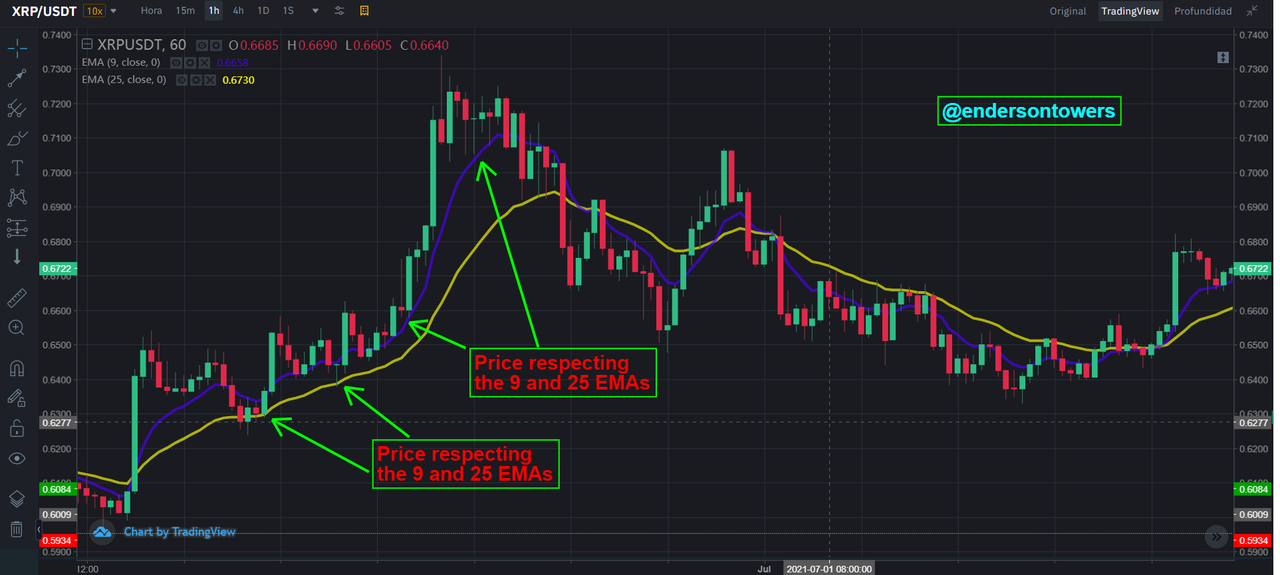
2 - Make a combination of Two different EMAs other than 50 and 100 and show them on Crypto charts as Support and Resistance. (Clear Charts Needed)
In my case I will use the exponential middle lines EMA 9 and EMA 25 in a chart of XRP / USDT, in a time frame of 1 hour, we can see the graph the two exponential EMAs one away from the other which gives us a good opportunity to our orders, always keeping the risk range under control, first do it to see the jump points of the resistances, we can see at the beginning it is located at the EMA 25 and then it tends to follow the line of the EMA 9 without exceeding this , and then reach the EMA 9 again. This is useful for placing an order either to buy or to sell.

Source
In the same way, we will do to visualize the EMA 9 and EMA 25 lines in relation to the supports, we can see the graph the two exponential EMAs one away from the other which gives us a good opportunity for our orders, always keeping the risk range low control, first do it to see the jump points of the supports, we can see at the beginning it is located at the EMA 25 and then the value tends to touch the EMA 25 line again, to follow the line of the EMA 9 without exceeding is. This gives us a very good indicator to place a buy or sell order.
Source
3 - Explain Trade Entry and Exit Criteria for both Buy and Sell Positions using dynamic support and resistance on any Crypto Asset using any time frame of your choice (Clear Charts Needed)
Next I will make an explanation about the entry criteria for both buying and selling, our investment depends on this, so we must have it clarified.
Entry criteria for buy position
1 - As a first point we must integrate the exponential moving EMAs lines 30 and 80 into our graph.
2 - We must be aware that the price is above both EMAs lines.
3 - We must wait very patiently for the candles to touch the EMA 30 line or exceed between it, when it touches it, we must wait to see the next movement of the trend, at this point we cannot buy because we do not know if it has strength to the down or up, for this reason you have to wait.
4 - If the price touches and crosses the EMA 30 line upwards, our movement is confirmed.
5 - When the candles touch the EMA 30 line and it goes up, it is our entry point to the operation, this point is very important because as long as the candles respect their position above the 2 EMA lines, each time the Price touches the 30 EMA line and goes upward is a new entry point.
BTC / USDT chart, on a 1 hour time frame.

Source
Entry criteria for the sell position
I recommend a lot of patience and caution in the sales criteria carried out since you must have knowledge of what we do so that the movement goes well.
1 - As a first point we must integrate the exponential moving EMAs lines 30 and 80 into our graph.
2 - We must be aware that the price is below both EMAs lines.
3 - We must wait very patiently for the candles to touch the EMA 30 line or exceed between it, when it touches it, we must wait to see the next movement of the trend, at this point we cannot sell because we do not know if it has strength to the up or down, for this reason you have to wait.
4 - If the price touches and crosses the EMA 30 line in a bearish way, our movement is confirmed.
5 - When the candles touch the EMA 30 line and it goes down, it is our entry point for the sell position of the operation, this point is very important because as long as the candles respect their position below the 2 EMA lines Every time the price touches the EMA 30 line and goes down, it is a new entry point to the sell position.
5 - When the candles touch the EMA 30 line and it goes down, it is our entry point for the sell position of the operation, this point is very important because as long as the candles respect their position below the 2 EMA lines Every time the price touches the EMA 30 line and goes down, it is a new entry point to the sell position.
BTC / USDT chart, on a 1 hour time frame.

Source
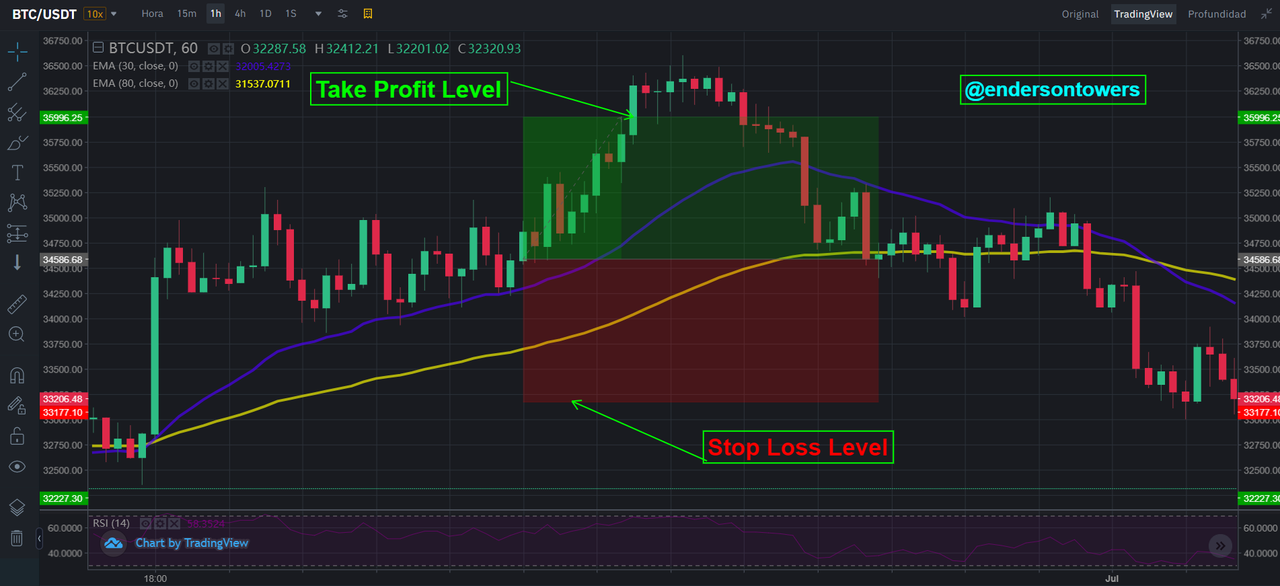
Exit criteria for the buy position
1 - I would start by visualizing if the price is above both EMAs lines.
2 - After the price bounces off the EMA 30 line, right after I place my order.
3 - Then I place the Stop Loss, it is placed below the exponential moving average EMA 80.
4 - If the operation is closed with the Stop Loss, we must wait for a new entry point to occur.
5 - I place the Take Profit level, and when the operation reaches the desired point, the crypto assets can be reserved.
6 - In my case, configure the Take Profit with the RR factor (Reward Risk) 1: 1.
BTC/USDT chart, on a 1 hour time frame.
Source
Exit criteria for the sell position
1 - I would start by visualizing if the price is below both EMAs lines.
2 - After the price bounces off the EMA 30 line, right after I place my Order.
3 - Then I place the Stop Loss, it is placed above the exponential moving average EMA 80.
4 - If the operation is closed with the Stop Loss, we must wait for a new entry point to occur.
5 - I place the Take Profit level, and when the operation reaches the desired point, the crypto assets can be reserved.
6 - In my case, configure the Take Profit with the RR factor (Reward Risk) 1: 1.
BTC / USDT chart, on a 1 hour time frame.

Source
4 - Place 2 demo trades on crypto assets using Dynamic Support and Resistance strategy. You can use lower timeframe for these demo trades (Clear Charts and Actual Trades Needed).
UNI / USDT chart with a 3 minute time frame, using the Dynamic Support and Resistance strategy, place my entry order for the buy position using the EMA 30 exponential moving average line, wait very carefully for the incoming candle to cross or hit the EMA 30 exponential moving line, just at that moment I expected it to bounce and the next candle to be created, at that point I made my investment of $ 14,990 at a price of $ 17,553. Right at this moment I activated the Stop loss below the EMA 80 line at a price of $ 17,414, and then I activated the take profit order with RR of 1: 1, my sell order was activated at the desired take profit point at a price of $ 17,692, My order closed with a profit of $ 15,073.

Source

Source
My second Demonstration Exercise.
BTC / USDT chart with a 3-minute time frame, using the Dynamic Support and Resistance strategy, place my entry order for the buy position using the EMA 30 exponential moving average line, wait very carefully for the incoming candle to cross or hit the EMA 30 exponential moving line, just at that moment I expected it to bounce and the next candle to be created, at that point I made my investment of $ 14.98 at a price of $ 32,295.55. Right at this moment I activated the Stop loss below the EMA 80 line at a price of $ 32,208.48, and then I activated the take profit order with RR of 1: 1, my sell order was activated at the desired point of the take profit at a price of $ 32,382.62, My order closed with a profit of $ 14.99.

Source

Source
Conclusión.
The dynamic support and resistance strategy is undoubtedly one of the most important that must be taken into consideration to carry out a good technical analysis of a pair, in addition to that we can implement other indicators to strengthen the correct reading of our technical analysis, to later organize strategies and place buy and sell orders that benefit us, the dynamic support and resistance strategy is excellent because it allows us to make multiple entries or multiple exits from the market as the case may be. Without a doubt, these last 3 classes have been great, and I love to expand my knowledge regarding market entry and exit strategies, thank you very much for attending my task. Greetings.

Dear @endersontowers
Thank you for participating in Steemit Crypto Academy Season 03 and making efforts to complete the homework task. You got 9.5/10 Grade Points according to the following Scale;
Key Notes:
We appreciate your efforts in Crypto academy and look forward for your next homework tasks.
Regards
@cryptokraze
Thank you very much teacher, I am glad that it has been to your liking, greetings.
I will continue to put my best performance on homework, I will be more attentive to the details.