Crypto Academy Season 03 - Week 03 | Advanced Course - Break Retest Break (BRB) Strategy to Trade Continuation. By @endersontowers
Source
After reading such a valuable topic on the break-up strategy, I congratulate professor @cryptokraze for raising awareness of such valuable topics as this, and that all students can take advantage of this type of teachings to implement them and take advantage of it in our day-to-day investments. . Next I will present my homework.

1 - What do you understand about the Concept of Break Retest Break Strategy? Give Chart Examples from Crypto Assets.
The repeated breakout breakout test (BRB) strategy, whose purpose is basically to take advantage of the trend directions and the momentum levels that waves or candles have to break resistance bullishly and supports bearishly, since many Operators focus on methods that have something to do with buying in large supports and selling in the vicinity of the resistances, but this makes some sense depending on your intentions in the market, whether to hold a long-term investment, the strategy (BRB) is used according to the reading of graphs either from 15min to 1h, in which we can find average levels of both support and resistance that is created depending on the fluctuation of the market as it is, remember that every time there is a constant oscillation between waves or candles, it is because a fight has been created between sellers and buyers, in which the market that obtains the most demand wins, therefore the The market itself is uncertain, with this strategy we can take anticipated measures for its entry and exit, as well as activating a “Stop loss”, through the “Take Profit”, this to prevent the trend from playing against us. input, there are two ways to develop this method.
BRB at the resistance level.
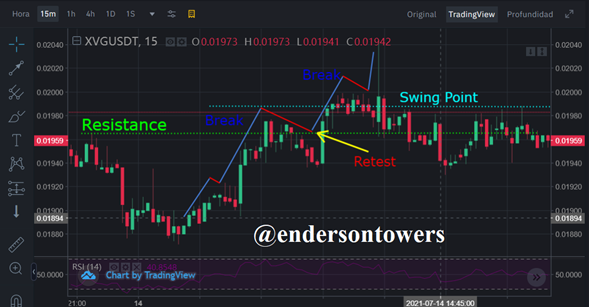
It is when we have a clear uptrend, and we already have the resistance points drawn, when the wave approaches and collides with the resistance, it will create an action that will make it go down again, otherwise if the candle has enough momentum force This will be surpassed by the resistance to liquidate many investors, which will cause it to touch the resistance line again, and then to push itself again, surpassing the previous highest point known as the "turning point", this impulse is known as "breaking ”, We can visualize it in the following graph, through the PAR, XVG / USDT, with a temporary view of 15min.
Source
BRB at the support level.
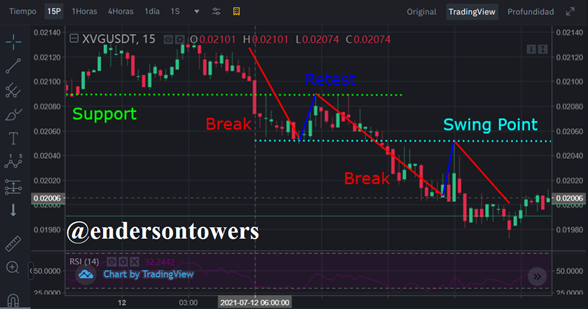
It is when we have a clear downtrend, and we already have the support points traced, when the wave approaches and hits the support, it will create an action that will make it rise again, otherwise if the candle has enough impulse force This will surpass the support to liquidate many investors, which will cause it to touch the support line again, and then to propel itself again surpassing the previous highest minimum point known as the "turning point", this impulse is known as " break ”, we can visualize it in the following graph, through the PAR, XVG / USDT, with a temporary view of 15min.
Source
2 - Mark important levels on Crypto Charts to trade BRB strategy. Do it for Both Buy and Sell Scenario.
Next I will explain the entry criteria for both buying and selling, this is very important to know, since our investment depends on it.
Entry criteria for buy position
1- We must have the resistance line well marked, then we would pay attention to the outside that brings the waves whenever it approaches the resistance line.
2 - We wait with great patience that it exceeds its greatest length, always waiting for the desire to buy.
3 - when the wave reaches its maximum length, the sales demand at that point will cause it to return to touch the resistance point again, and then rise strongly.
4 - We expect the line of the new wave to pass the previous highest point with force and thus we would have a valid break.
5 - Lastly, we would place our buy order just after the wave line surpasses the “Swing Point” line.
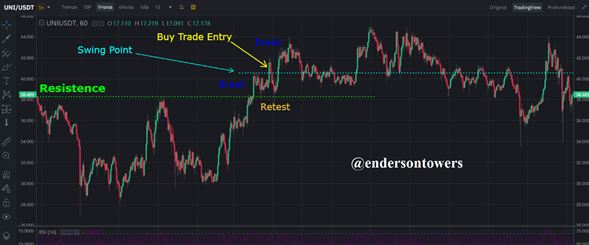
Now, you must take the buy entry just above the swing break point.
UNI/USDT chart on a 1H time frame showing buy-in criteria.
Source
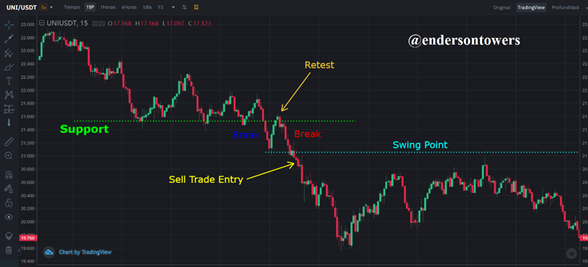
Entry criteria for the sell position
To carry out the sales criteria we must pay close attention and be very patient with all the movements.
1- First we must draw a "support" line.
2 - We must wait and be very patient, waiting for the new wave to break below the "support" level, and then bounce back positively.
3 - We expect the wave to get close to the "support" line, and the demand in sales will make it go down again.
4 - The wave that is formed must forcefully break the “Swing Point” line for it to be a valid break.
5 - We place our Sales Entry or sell order, just after the wave surpasses the “Swing Point” line.
UNI/USDT chart on a 15 minute time frame showing sell entry criteria.
Source
3 - Explain Trade Entry and Exit Criteria for both Buy and Sell Positions on any Crypto Asset using any time frame of your choice (Screenshots Needed).
Exit criteria for the buy position
1 - I would start by drawing the resistance line which allows me to locate myself in the diagram.
2 - Then it would wait for the corresponding jump to take place until reaching the Swing Point, and wait for its respective bounce towards the resistance line, and then bounce again until the Swing Point line.
3 - When the jump candle is breaking the Swing Point line with force, it is my time to enter, if it does not break it, we must wait for it to do so in another oscillation.
4 - I place an exit order for the buy position right after the candle breaks the Swing Points line.
5 - Next I place the Stop Loss just below the resistance.
6 - I place the Take Profit level, so when the operation reaches the desired point, the crypto assets can be reserved.
7 - in my case I am working the take profit with the RR favor (Risk Reward) 1: 1.
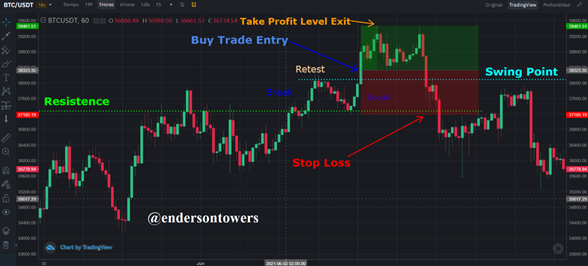
BTC/USDT chart in 1H time frame showing Exit Criteria for buy position
In the following diagram we can see an exit order for the buy position at a value of $ 38,323, a Stop loss at $ 37,185, and a Take Profit Level exit of $ 39,461 in profit.
Source
Exit criteria for the sell position
1 - I would start by drawing the Support line which allows me to locate myself in the diagram.
2 - Then it would wait for the corresponding jump to take place until reaching the Swing Point, and wait for its respective bounce towards the support line, and then bounce back to the Swing Point line.
3 - When the jump candle is breaking the Swing Point line with force, it is my time to enter, if it does not break it, we must wait for it to do so in another oscillation.
4 - I place an exit order for the sell position right after the candle breaks the Swing Points line.
5 - Next I place the Stop Loss just above the support level.
6 - I place the Take Profit level, so when the operation reaches the desired point, the crypto assets can be reserved.
7 - in my case I am working the take profit with the RR favor (Risk Reward) 1: 1.
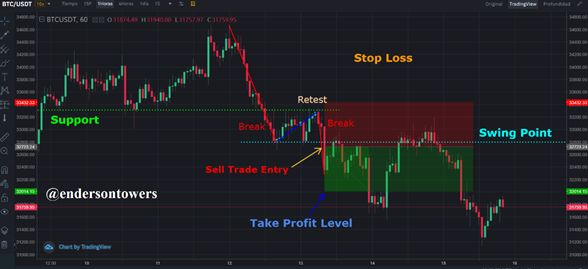
BTC/USDT chart on a 1H time frame showing sell entry criteria.
In the following diagram we can see an exit order for the sell position at a value of $ 32,723, a Stop loss at $ 33,432, and a Take Profit Level of $ 32,014 profit.
Source
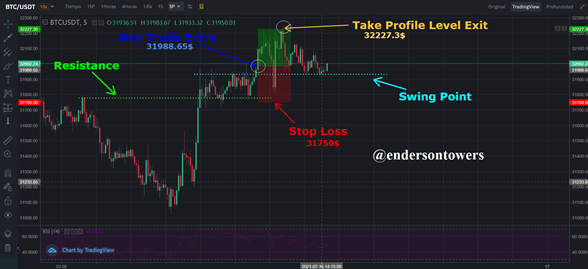
4 - Place 2 demo trades on crypto assets using BRB Strategy. You can use lower timeframe for these demo trades (Screenshots Needed).
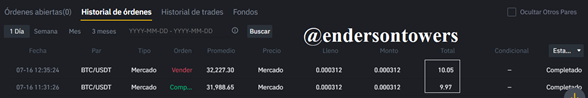
BTC/USDT chart on a 5-minute time frame showing the entry criteria for selling, by means of the resistance line I very carefully waited for the incoming candle to surpass the Swing Point forcefully, just at that moment I made my investment of 10 $ at a price of $ 31,988.65 here activate the take profit order with RR of 1: 1, where the stop loss is at the lowest point of the support line, and our exit from the market was at the high point of the take profile at a price of $ 32,227.3, My order closed with a profit of $ 10.05.
Source
Source
My second investment
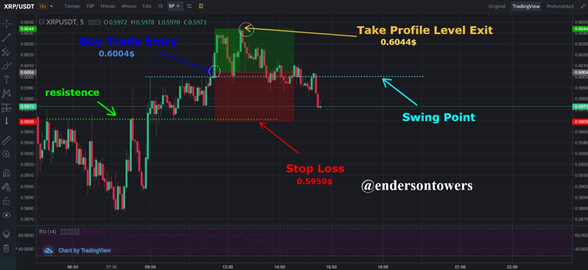
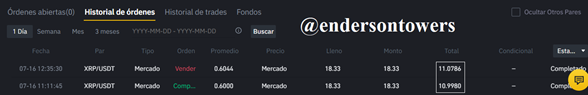
XRP/USDT chart on a 5 minute time frame showing sell entry criteria, using the support line, very cautiously wait for the incoming candle to forcefully pass the Swing Point, just at that moment I made my investment of $ 11 at a price of $ 0.6000 here activate the take profit order with RR of 1: 1, where the stop loss is at the lowest point of the support line, and our exit from the market was at the high point of the take profile at a price of $ 0.6044. My order closed with a profit of $ 11.0786.
Source
Source
Conclusión.
The Break Retest Break Strategy (BRB) is a good method that allows us to generate profits as long as we do not get out of the context, we must respect each part of the entry and exit methodology, as well as the take profit, and the Stop loss First of all in case we make a bad reading, above all we must make a good reading of support and resistance, if this strategy is recommended to use it between 15min to 1 hour, since it is a strategy that is commonly used in small amounts of time , and allow us to make faster movements while the market is developing, I liked this strategy. Excelent topic.
Thanks for coming.
Dear @endersontowers
Thank you for participating in Steemit Crypto Academy Season 03 and making efforts to complete the homework task. You got 9/10 Grade Points according to the following Scale;
Key Notes:
We appreciate your efforts in Crypto academy and look forward for your next homework tasks.
Regards
@cryptokraze
Thank you very much teacher, I am glad that it has been to your liking, greetings.
I will continue to put my best performance on homework.