Crypto Academy Season 4 | Advanced course | week 6: Crypto Trading With Chaikin Money Flow Indicator
it's my pleasure participating in this week's lecture on CMF by Professor @kouba01, it's actually pleasurable and expediting research.
**Chaikin money flow indicator**.
Money flow is one of the most important factors in predicting price movements of a commodity market, by knowing how the movement of money flows in the market, we can predict prices and see what trends are happening in the market so that by knowing these 2 things so we can determine when we will buy an asset or when we will sell it. One of the indicators that serve to see the flow of money in this market is "Chaikin Money Flow".
The chaikin money flow was developed by Marc Chaikin and attempts to determine if a stock is under accumulation or distribution by comparing the closing price to the high-low range of the trading session. In layman’s terms, if the stock closes near the high of the session with increased volume, the CMF increases in value. Conversely, if the stock closes near the low of the session with increased volume, the CMF decreases in value. The chaikin money flow indicator was developed as an expansion to the On Balance Volume indicator.
Chaikin Money Flow Charting Example
Question
In your own words, give a simplified explanation of the CMF indicator with an example of how to calculate its value?
The one who made Chaikin Money Flow (CMF) was Marc Chaikin, and it was made to see and also helps to identify the market trends and market strengths as it is a technical indicator.
As we know that there are many Oscillating Indicators, as we have studied about them in Steemit Crypto Academy like Moving Average Convergence Divergence (MACD), Relative Strength Index (RSI) and there are also some which we have not studied but are used by many traders like Commodity Channel Index (CCI), Awesome Oscillator (AO) and many more. Chaikin Money Flow (CMF) is also an Oscillating Indicators.
In the Oscillating Indicators, there are two lines Up and down, which indicates the market movement. The Chaikin Money Flow (CMF) measures the buying and selling pressures and sees if the market is going up or down during a specified time.
Chaikin Money Flow (CMF) Oscillatory line moves in a certain period, as the Marc Chaikin suggested period is 21, while it also works on the default setting which is 20. Chaikin Money Flow (CMF) Oscillatory line moves around Zero(0) line between 1 and -1.
So in this, if the market price got close above Zero means that market is
Chaikin Money Flow (CMF) is a trend-identifying indicator, so it is not advised to use it alone.
Calculating the value of Chaikin Money Flow (CMF)
The formula to calculate the Chaikin Money Flow (CMF) is divided into three parts:
Calculating the Money flow multiplier:
Cash Flow Multiplier = [(Close price - Low price) - (High price - Close price)] / (High price - Low price)
Calculation of the volume of cash flows:
Cash flow volume = cash flow multiplier x volume for the period
Calculation of Chaikin Money Flow:
Chaikin Money Flow = sum of 20 or 21 periods of cash flow volume/sum of 20 or 21 periods of volume
So here lets' take some hypothetical values, and then put them in the above formulas:
High : $1000
Low : $600
Close : $950
21 Period Sum of Volume : $400
Volume for the Period : $200 my
Chaikin Money Flow was developed by Marc Chaikin and is a primary used a confirmation tool for trend trading in stocks. It combines both price action and volume into one indicator, as the founder believes that volume leads price.
CMF moves above and below zero based on whether, on average, the stock is finishing in the upper portion of the daily range or the lower portion respectively. Each day is multiplied by volume, so a down day accompanied by big volume will result in a lower indicator reading than a down day on small volume.
While the indicator is typically used on daily charts, it can also be used on intraday charts where volume data is present. A 21-period indicator is commonly used, because it represents approximately 1 month worth of trading days. Multiples of this number are also used, such as 42, 63, 84, 126 or 252. For short-term trading a fewer number of periods will be favorable since the indicator will react quicker to trend changes. Longer-term traders will prefer a longer period CMF indicator.
One of the main ways to use Chaikin Money Flow is to confirm breakouts.
Isolate a resistance/support area where the price has had trouble getting above/below it on a number of attempts. Mark these areas as resistance or support.
When the price rallies through resistance, look for the CMF to confirm the breakout. CMF should be above zero. If it isn’t, it warns the breakout could likely fail.
When the price falls through support, look for the CMF to be below zero to confirm the breakout. If the price breaks support but the CMF isn’t below zero, the breakout is likely to fail.
Bearish Divergence
We notice a bearish divergence when there is weakness in the buyers' pressure in the market. A Bearish Divergence is signified by the downward movement of the indicator while the price rises. This is a good sell signal
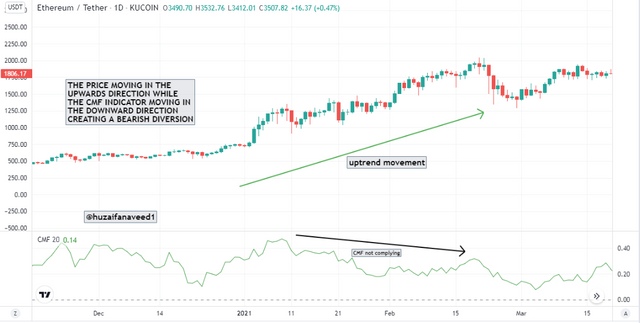
In the demonstration above of ETH/USDT, we can clearly see that the price was showing a bullish movement making higher highs while the CMF indicator moved downwards forming lower lows. This means that the Buyer's pressure in the market is diminishing and we will see a trend reversal.
Bullish Divergence
We notice a bullish divergence when there is weakness in the sellers' pressure in the market. A Bullish Divergence is signified by the upward movement of the indicator while the price falls. This is a good buy signal.
.PNG)
The price was hitting resistance just below $37, which it couldn’t get above on multiple attempts. Then, in October, first the CMF turned positive and then the price broke above resistance. Since the CMF was still positive it confirmed the breakout.
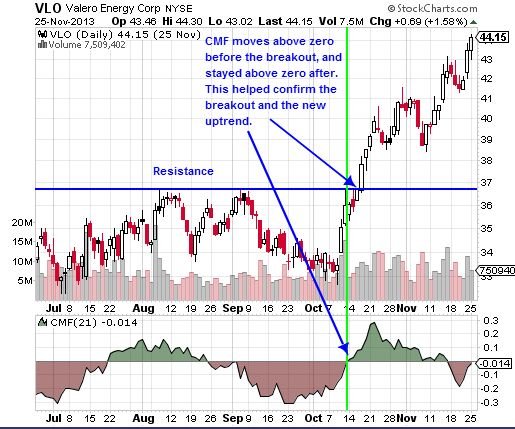
(buy calls), the CMF could have helped solidify that decision.
This how the indicator confirmed a downside breakout.
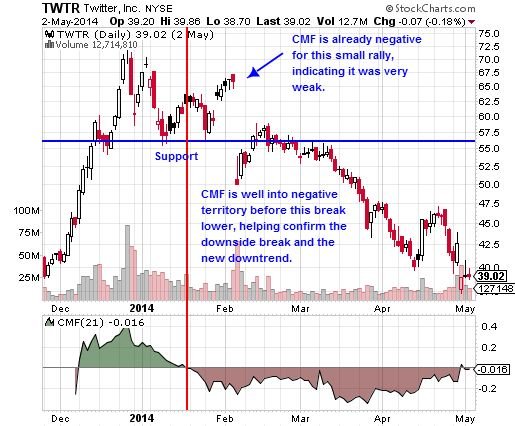
The stock had found support on a number of attempts just above $55. The CMF turned and stayed below zero even while the price rallied a bit, before eventually gapping below support. The negative CMF reading showed the uptrend was weak, and confirmed the downside breakout. That the CMF stayed below zero following the breakout also helped confirm the new downtrend.
For traders looking to go short the CMF would have given them confidence in their decision.
Final Word
The Chainkin Money Flow is a tool that uses both price and volume to confirm the trend or warn of weakness. It isn’t usually used to provide trade signals itself, rather it simply helps to confirm signals using other strategies, such as breakouts or trend trades. For long trades the CMF should be above zero, and for short trades the CMF should be below zero. This shows that momentum (price) and power (volume) are both moving in the same direction as the trade.
.png)
In the first green circle, you see the moment when the price switches above the 15-period EMA. This is the long signal we need from our EMA. 15 minutes later, the Chaikin line increases above +0.2000, which is considered a very high reading. We get a long signal confirmation and we buy Visa at $70.08 per share. This trade lasts for almost an hour, which is pretty long for a day trade. This trade generated $0.35 cents of profit (.5%).
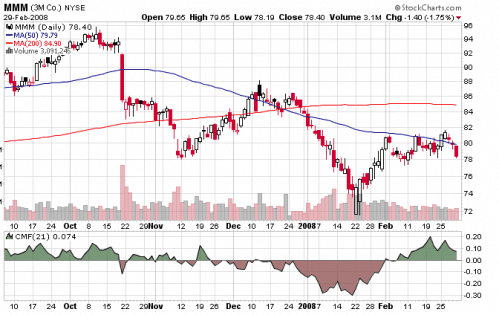
Above is a Daily Candlestick Chart of the Intel Corporation (INTC). The histogram seen in the lower window pane represents a 21 period Chaikin Money Flow indicator, drawn using the preferences seen below.
Money flow multiplier
The first step is to determine each period’s money flow multiplier as follows:
Money Flow Multiplier = ((Close value – Low value) – (High value – Close value)) / (High value – Low value)
Money flow volume
The next step is to calculate the volume of money flow by multiplying the volume for the period by the money flow multiplier obtained in step one. It is usually calculated on a daily basis but can be figured otherwise, such as hourly or weekly.
Money Flow Volume = Money Flow Multiplier x Volume for the Period
CMF
The last step is to calculate the CMF value. Simply divide the daily money flow over a certain period of time by the sum of volume for the same period. The default number of periods for CMF is 21 days, as this represents the trading over the past month.
Unfortunately @emmytexfrankline, your reputation does not allow you to participate in this advanced homework. You must have at least 65 reputation and 600SP in your wallet.
@kouba01 please how can I get such 600SP in my wallet please I'm confused .. please help me out