Steemit Crypto Academy Contest / S4W1 - Crypto Market Technical Analysis by @emmy7924
 Designed using flyer maker
Hello friend, how are you doing today. I sincerely welcome you to my post today friend. Indeed it is good to have you around here. Today I have discussed technical ANALYSIS as part of my entry to the contest that was organized in SteemitCryptoAcademy Community. Let's take a look at all what I have discussed.
How would you define Technical Analysis in the Crypto ecosystem? Mention its Importance.
The word technical analysis, is a very popular word that is used in the crypto ecosystem by traders and Investors. Technical analysis is define as the process that is used to study the past price actions of a cryptocurrency and anticipate future price movement of the cryptocurrency on a chart.
In other words, technical analysis is define as a branch of study that is used by crypto traders to anticipate the future movement of cryptocurrency by studying the historical market data of the traded cryptocurrency.
Technical Analysis make use of data that are prices, volume, and open price of the market. Traders make use of trading data together with technical indicators which is a mathematical indicatiors to make a good trading decisions so they can minimize they losses.
Important of technical analysis:
There are a lot of Important of technical analysis which I have details out few of them below.
Technical Analysis can be use in all area of financial instruments at any point in time.
Technical Analysis be use in both short term and long term trading which help trader to minimize they risk.
Technical Analysis is use to predict price which also trader can use it to make decisions before they can enter the market or exist the market.
Do you have practical knowledge of how to conduct technical analysis? Highlight some of the components of Technical analysis.
I have little knowledge about how to conduct technical analysis. In order to conduct technical analysis, one needs to understand how to use the analysis and be conversant with the components of technical analysis highlighted below.
- Chart
- Price and volume data
- Indicators/Tools
Chart
Chart is one of the component of technical analysis that display both volume data, price data on a chart for trader to view so as to enable them make proper decisions.
Price and Volume data
Price and volume data is the components that display the current price of of the asset for buyers and sellers to agreed on. The volume data is often displayed the trading speed of the asset I.e the bit and ask price.
Indicator and tools
Indicators and tools are the components that traders use to study the market like knowing if the market is currently at the level of overbought or oversold and also knowing the levels of support and resistance.
What do you understand by technical indicators? Do you consider them effective for trading cryptocurrency? Which one is your favorite and how does it work? (Screenshots required where necessary)
Technical indicatiors is a mathematical tools that is use to predict the future price of a cryptocurrency from the study of past historical price data. Technical indicatiors involves the uses of past historical data and current historical data to determine the future price of an assets.
To me, I highly consider technical indicatiors very effective for trading cryptocurrency because by using technical indicatiors, a trader can easily minimize his or her risk.
Moving Average Convergence Divergence (MACD) is my favorite Indicator. It is use to see the direction and know the momentum of a trend that provides more than one different trading signals. In MACD, when the price of the asset is moving in an uptrend, you will get to see the MACD line above zero, buy in a case where you get to see the line below zero MACD I am indication of a bearish market.
The moving average convergence divergence works better when it is use with three components: two moving average (MA), and a histogram.
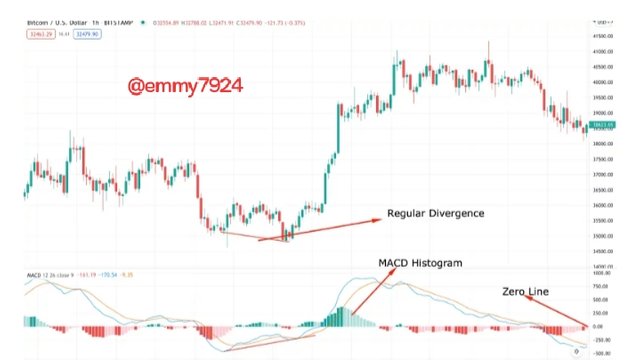 screenshot gotten from Tradingview
In the indicator, there is a two line that looks like that of simple moving average (SMAs), which are not instead there are exponential moving average (EMAs). MACD is the slower line, whereas the fastest line is that of the signal line.
Highlight the advantages and disadvantages of technical analysis. What's your advice to anyone about it?
Technical Analysis has it own advantages and disadvantages of which I have shared some of them below.
Advantages of Technical Analysis
The main advantages of technical analysis is the ability of the tool to identify price trend and it signs in the market.
The ability to identify price trend in the market is the main reason as to why traders are using technical analysis in conducting they operation so as to come up with good result. With this traders can be able to identify both entry and exit points in the market.
Also technical analysis, is very easy to use and common in the market for carryingout analysis. It is also help traders to be able to identify the support and resistance levels.
Disadvantages of Technical Analysis
The main disadvantages of technical analysis is that there is usually an element of market behavior that is sometime unpredictable by traders. This means that due to the randomness and efficiency of the analysis, the market cannot be measure accurately.
Another disadvantages of technical analysis is that it is not guarantee when predicting the future of the market base on past historical price.
My advice to anyone about technical analysis
My advice to anyone about technical analysis is that the person should combine technical analysis with other indicatiors to get a better results of the what the market is really saying.
As a beginner trader you should also employ the use of technical indicator with the use of technical analysis so you can be able to spot the levels of support and resistance and also get to know your entry and exit price.
I am inviting;
@preye2
@rubilu123
@badmus-official
Hello you have tried your best in discussing about technical analysis in your own words. Thank for what you have shared with us best of luck to you.
Thank you for stopping by.