Understanding Trends - Crypto Academy / S5W1- Homework Post for @reminiscence01
Hello everyone, welcome back to the crypto Academy, hope you've all had it great thus far?
on the topic today, I will be showing how to make trend analyzes just by using the market structure and as well the trendlines.

A trend can be characterized as the course in which the market moves in a particular period.
A trending market can be defined as a timeframe during which a cryptocurrency asset or other kind of monetary asset has the earmarks of moving in a specific direction.
A trending market is a market movement where prices are moving toward the same path, either moving in an uptrend or in a downtrend. The market trend is mostly classified into two-part, The buyer's trend and the seller's trend.
A buyer's trend is when a market is moving upward, while a seller's trend is when the market is declining.
At the point when a market starts trending, traders adjust their trading position in a similar way the market is moving so as to take advantage of the market trend. Moreover, the markets might keep on trending for minutes, hours, days, or weeks.
Generally, A Trending market can be referred to as the apparent course of market developments over a specific period of time. Market trends as well apply to all resources where there's development on price or the amount of an asset purchased and sold.
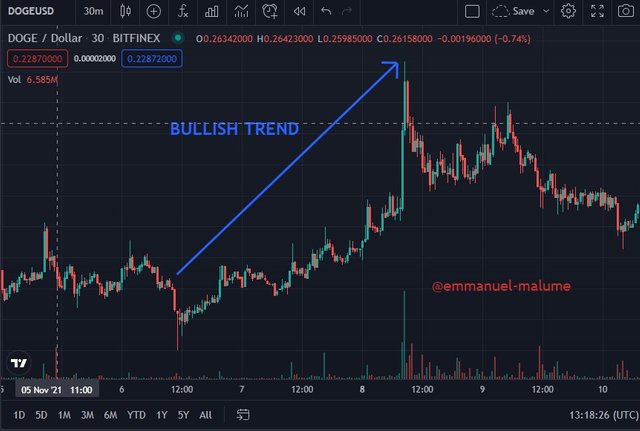
Bullish Trend:
A Bullish Trend is a trend characterized as when the market trend of an asset is moving in an upward direction, that is when there are more people plunging to invest in an asset and as well when the buyers are in control of the market.
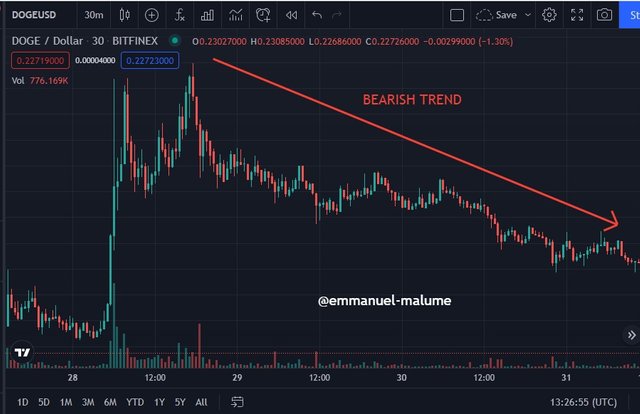
Bearish Trend:
A Bearish Trend indicates the opposite of bullish as it is a trend characterized when the market trend of an asset is moving in a downward direction, that is when the market is pessimistic and as well when the sellers are in control of the market.
Question 2 - Explain the following trend identification and give an example of each of them. (Original screenshot needed from your chart). Do this for a bullish and a bearish trend.
i) - Market Structure:
Market structure is a trend following apparatus that traders peruse and follow dependent on how the price of an asset moves . It might be from bullish movement to bearish or vice versa.market structure is how the entire market moves.
Market structure is a significant trading analysis tool, trades use to have the option to recognize what the market has been doing previously and what it can do later on.
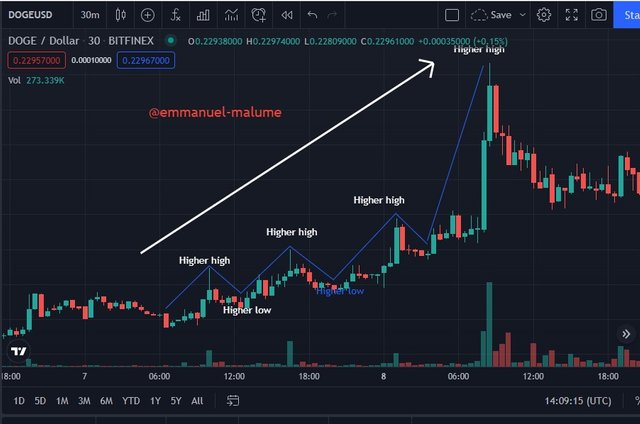
Bullish Market Structure:
A Bullish market structure is a progression of higher highs and higher lows on the chart as when the asset price is moving in an upward direction, We can distinguish this series by discovering at least 2 arrangements of higher highs and higher lows from a trend .Example shown below
Bearish Market Structure
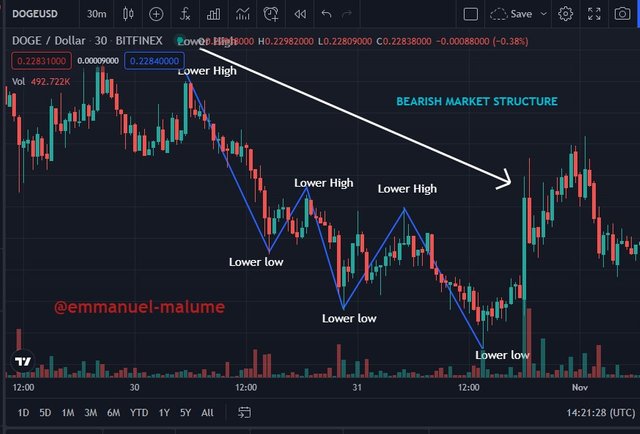
A Bearish market structure is a sequence of lower highs and lower lows on the chart as when the asset price is moving in a downward direction, We can distinguish this series by discovering at least 2 arrangements of lower highs and lower lows from a trend .*Example shown below
ii) - Trendlines
Trendlines will be the lines drawn at a point above or beneath an asset price. The trending lines are utilized to give signals concerning the current trend and clarify when a trend has changed.
Bullish Trendlines:
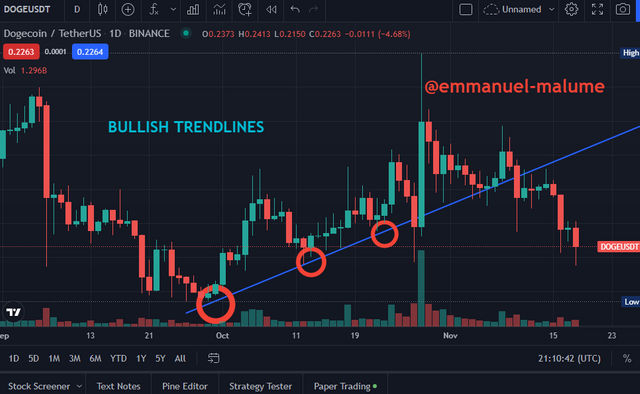
A bullish trendlines are the lines drawn underneath the price of an asset and somewhere around two highs or two lows are expected to point in the bullish indirection.
Bearish Trendlines:
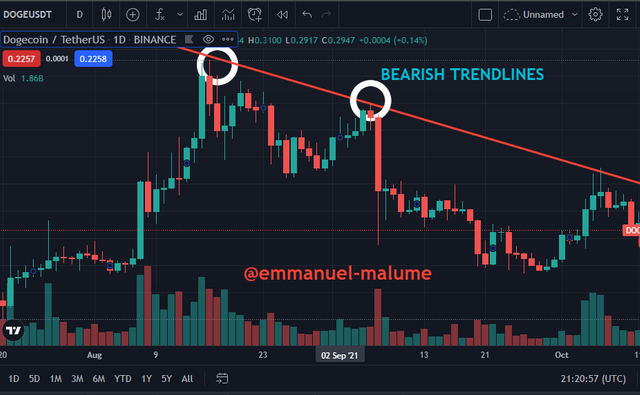
A bearish trendlines are the lines drawn above the price of an asset and somewhere around two lows are expected to point in the bearish direction
Question 3) - Explain trend continuation and how to spot them using the market structure and trendlines. (Screenshot needed). Do this for both bullish and bearish trends.
Bullish market
For a market to be considered to be still bullish, we need to see the market creating a higher high and higher low in the market. This means:
1.The next market high must break above the previous high
2.We need to see the low of the previous high not broken
A good example can be seen below on the mana usdt chart below :
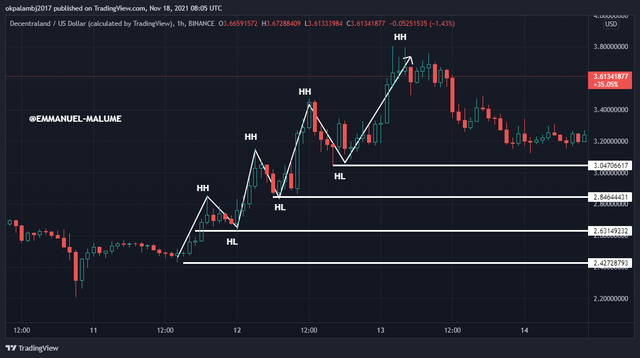
HH-higher high
HL-higher low
BEARISH MARKET
This is for a market going downwards or should I say downtrend we can confirm this market when we see new lower lows and lower highs being formed. The conditions are as follow:
1.The new low must break the previous low
2.The new high cant break above the previous high meaning that the high formed will be between the previous high and its low.
A good example can be seen below with the UMAUSDT chart below :
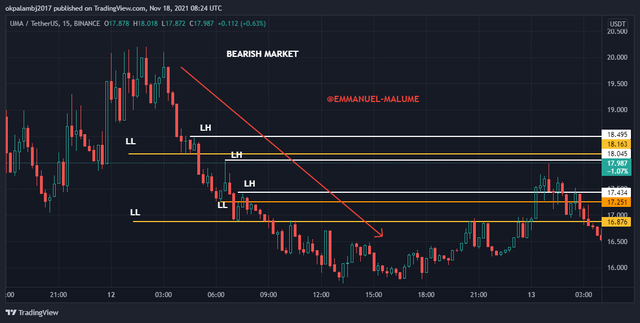
LL-lower low
LH-lower high
TRENDLINE:
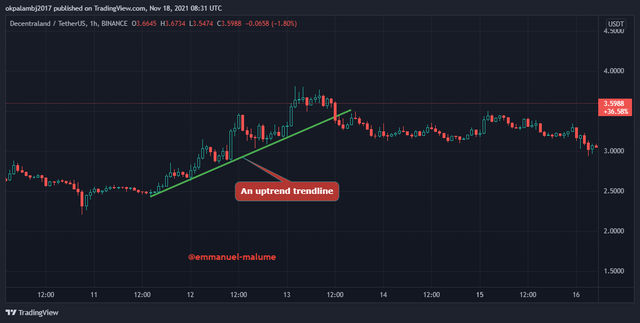
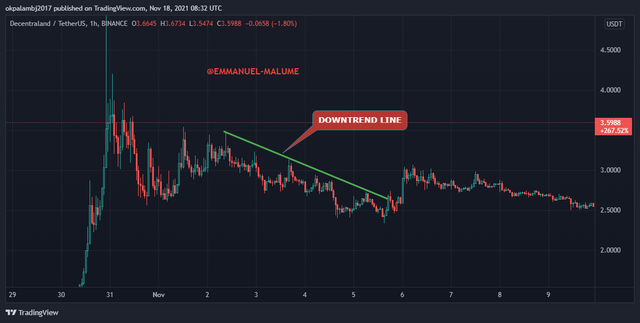
To confirm continuation trend using trendlines, it differs for uptrend and downtrend. For an uptrend we draw the trend line below and provided the market stays above the trendline we can say is an uptrend while for a downtrend we draw the trendline above by connecting the lower highs and provided that the market stays below the trend line we can say we are still in a downtrend. We can see two examples below:
UPTREND
DOWNTREND
Question 4) - Pick up any crypto-asset chart and answer the following questions -i) Is the market trending?ii) What is the current market trend? (Use the chart to back up your answers)
I will be using the doge usdt chart for this question and looking at the chart below
-i) Is the market trending?
yes, the market is trending in a downward direction.
ii) What is the current market trend? (Use the chart to back up your answers)
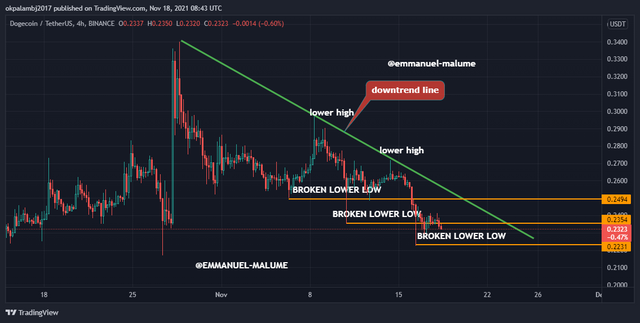
The market is in a downtrend and forming clear lower highs and lows and with our drawn trendline by connecting two lower highs, the price is still below it which confirms the downtrend.
Conclusion
Here comes the end of the topic trend analysis , as we've explained earlier the importance of market structure as it can be considered a trend analysis tool traders can use to analyze market movement and as well predict what the market might do in the nearest future.
Trend lines are the line drawn above(bearish) and beneath(bullish) the market price so to know the exact condition of the market and as well predict when the current mood of tee market will change.
See you on the next topic!!
Cc: @reminiscence01
Hello @emmanuel-malume , I’m glad you participated in the 1st week Season 5 of the Beginner’s class at the Steemit Crypto Academy. Your grades in this task are as follows:
Recommendation / Feedback:
Thank you for participating in this homework task.
Good morning, pleas why was my markdown mark reduced so I can work on it and again , what is wrong with the analysis