Steemit Crypto Academy Season 3 Week 2 - Beginner's Course | Introduction to Charts for @reminiscence01 by @emmanuel-malume
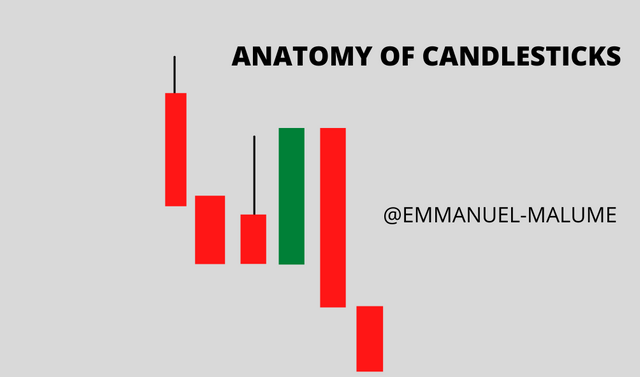 IMAGE MADE FROM CANVA
1.Explain the Japanese Candlestick Chart? (Chart screenshot required)
Before we talk about candle sticks , we should talk about what is a chart first . We all know price moves up and down, representing this movements involves the use of a tool called charts .
Charts can be defined as the use of various resources in form of lines , candlesticks , bar charts , Renko charts , tick charts to represent price movements over a specific period of time . Chart works with time frame . Time frame is the duration of time a unit of a chart is formed .
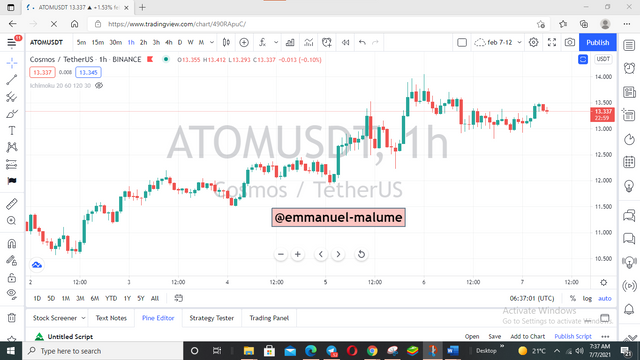
image from trading view
There are different types of chart used for representing price movements . They include:
- Line chart
- Bar chart
- Candlestick chart
- Renko chart
- Volume chart

The term candle stick charts is formed from from two key words; candle sticks and charts . A candle stick is a traditional way of light that has a wick coming off of it while chart like I said above is representation of price movement over a period of time .
This term combined together means representation of price movements over a specified period of time using a candle stick .Candle stick charts are also called Japanese candle sticks cause it was invented by a Japanese rice seller known as Munehisa Homma.
A candlestick is made up of its body, open, close and wicks
.png)
Open- this is the point where price opens up at a particular period of time
Close - this is the point where price closes over a specified period of time
High - this is the highest point price reached over a period of time
Low - lowest amount price reached over a specified period of time
Shadow or wick - highs and lows that were not where didn’t price close at or open at . It is those unsettled movements in a market where buyers and sellers are battling out how price turns out before it settles at the close. The longer the wick , the more volatile price of an asset was during the formation of the candlesticks
NO 2:Describe any other two types of charts? (Screenshot required)
Apart from the candle stick chart , I will also talk about line chart and Renko charts .
LINE CHART
This is the representation of price movement through the connection of dots known as data points to form a continuous line
This type of chart is best for identifying trend cause it blocks of all information except price at a particular point in time .
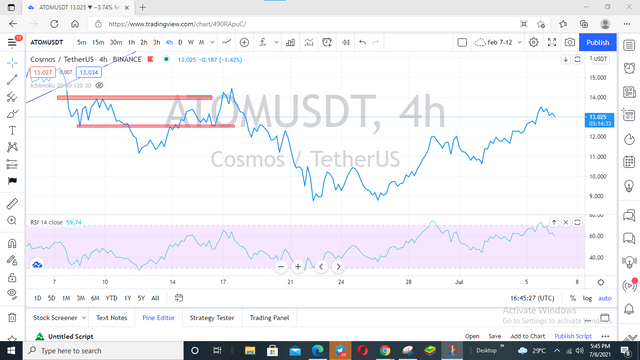
image from trading view
RENKO CHARTS
Another Japanese invention concerned with representation of price movement but this time around they don’t use candle sticks but rather bricks . These bricks have a fixed size of 10 points either in an upward Or downward direction . Once price exceeds that list in any direction , another brick is formed .
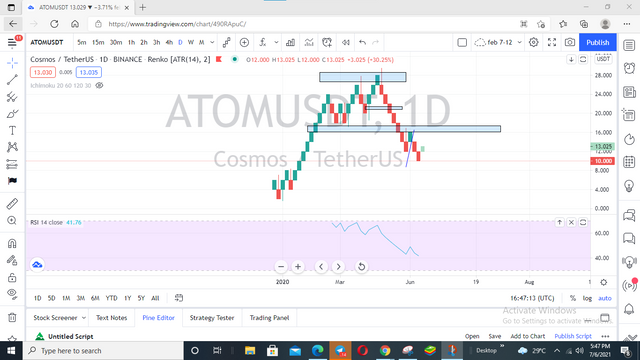 image from trading view
NO3: In your own words, explain why the Japanese Candlestick chart is mostly used by traders
People want something that gives a clear detail or information about something . This is where candle stick tops all forks of charts . In a candle stick , one knows how price closes , where the price reached during a period of time , where it closed , whether it ended bullish or bearish using the colour of the candle sticks , type of candle stick pattern formed ( either doji , engulfing , gravestone , dragonfly ).
NO4:Describe a bullish candle and a bearish candle identifying its anatomy? (Screenshot is required)
There are two major types of candlestick :
- Bullish
- Bearish
BULLISH CANDLESTICKS
Bullish means positive movement of price . A bullish candle sticks means more people have a good feeing about an asset and they are buying it pushing the price higher. So a bullish candle stick is formed when the closing of price is above its opening price . This is often represented with a green candle in most platforms although you can set it to your own taste in form of white or blue candle stick
.png) IMAGE FROM CANVA
IMAGE FROM CANVAOpen- this is the point where price opens up at a particular period of time. This opening price in a bullish chart is always below the closing bullish means positive increase in price
Close - this is the point where price closes over a specified period of time and this is always above the opening price since a bullish candlesticks shows a positive increase in price
High - this is the highest point price reached over a period of time where buyers are battling it out with sellers but sellers succeeded in bringing price down but not past the closing point
Low - lowest amount price reached over a specified period of time where sellers are battling it out with buyers but buyers succeeded in bringing price up and above opening price
Bearish means negative movement of price . A bearish candle stick alone does not represent a downtrend in the market but rather shows that traders are looking to sell the token So a bearish candlesticks is toned when the closing of price is below its opening price . This is often represented with a red candle or a black candlesticks or one can adjust it to their preferred color
.png)
Open- this is the point where price opens up at a particular period of time. This opening price in a bearish chart is always above the close cause a bearish candlestick shows a decrease in price
Close - this is the point where price closes over a specified period of time and this is always above the opening price since a bullish candlesticks shows a decrease in price
High - this is the highest point price reached over a period of time where buyers are battling it out with sellers but sellers succeeded in bringing price down and past the opening point
Low - lowest amount price reached over a specified period of time where sellers are battling it out with buyers but buyers succeeded in bringing price up but not past the closing price of the asset

CONCLUSION

Candlesticks charts is my one of the most important basics of analyzing price cause they are what represents price moments and you can predict the next price movement with higher possibilities . They are fundamental for technical analysis too. i thank @reminiscence01 for this wonderful class
Hello @emmanuel-malume , I’m glad you participated in the 2nd week of the Beginner’s class at the Steemit Crypto Academy. Your grades in this task are as follows:
Recommendation / Feedback:
Valuable explanations on Japanese candlestick and its anatomy. Thank you for participating in this homework task.