[linear regression indicator] - Crypto Academy / S5W5-Assignment posting for kouba01
Hello everyone, welcome once again to the crypto academy.
This is the fifth week of the season where on will be discussing with you the topic "Crypto Trading With Linear Regression Indicator". A course lectured by professor @kouba01, below is my warm entry;

Q1. Discuss your understanding of the principle of linear regression and its use as a trading indicator and show how it is calculated?
My basic understanding of linear regression is that it's an indicator that displays lines based on numerical data used to catch the assurance of a particular variable. For our situation, we will be using the linear regression line to catch the variable development of crypto resources.
At an essential level, linear regression can be used to distinguish trends and as well the trend course. The linear regression utilizes the calculation of standard deviation to give traders a sign regarding when markets are becoming overbought or oversold compared with the drawn-out lines.
The linear regression line is a condition that is used to record past execution to foresee future price qualities. The market is considered to be overvalued when it falls over the regression line and as well the market is considered undervalued when it's under the regression line.
USES
In a simple analysis, the best way to use the Linear regression line is to check its activity on a trend
Entry: The Linear regression line can be used to make entry into the market when the linear regression line is moving below the market price, which at that point, we consider the market to be overvalued/ overbought and that could be the best position to make our buy entry.
Exit: The indicator as well can be used to depict to traders the perfect time to exit to stop loss earlier, the indicator exit is determined at the point the indicator cut through the line and moves downward, i.e a scenario where you witness the indicator moving above the market price is considered the market to be undervalued/overbought then traders should make exit and avoid loss.
How it is calculated
Just like have said earlier, the linear regression uses complex numbers to figure the regression analysis, this analysis is created in numerical form x and y
where we get to refer to the " X" as the buyers dependent on the sellers
and as well "Y" as the independent sellers.
where we get the "m" to be the number of periods (days)
and the "b" to be our standard deviation, it could be one standard deviation (65%) or two standard deviations (95%)
the formula for calculating regression is given as ;
Y = mX + b
calculating the regression line is complex, that's why its default settings made the calculation and have it depicted with the indicator instead.
Q2. Show how to add the indicator to the graph, How to configure the linear regression indicator, and is advisable to change its default settings? (Screenshot required)
To add the regression line indicator to the chart, I will be using the trading platform "trading view" to carry on the task.
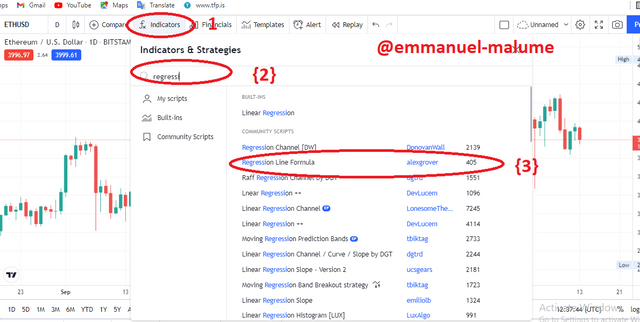
- From the trading platform "TradingView", click on "Indicators{1}", search for "Regression{2}", then click on the "Regression Line Formula{3}" to have it on the chart.
Image illustration below
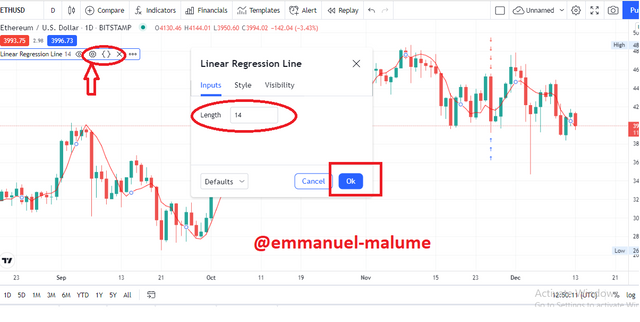
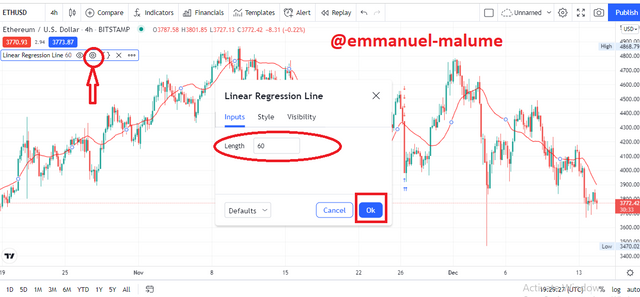
To configure the regression line indicator, you simply click on the settings which then launches you to the input settings, then on the "Length" which is the period at which you want the indicator to be displayed, just as seen by default the length is at "14".
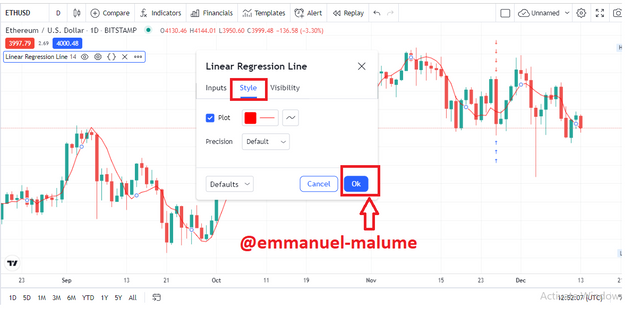
The other configuration that can be made on the indicator is its style setting, that is the style at which the indicator is displayed, in my case I choose to leave the indicator color at "red" and as well the line as in "graph"
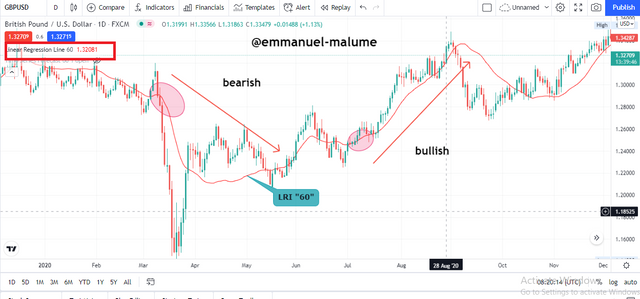
The indicator default settings are at length 14 which means it provides a signal of the previous 14 days, the indicator length can then be set to the period length at which traders had chosen to trade. I will be showing how I made adjustments to the indicator which I did set the length to be at "60".
After applying the settings then we could see the difference it made on the chart. as we get to see the Regression line displays in the period of 60 days.
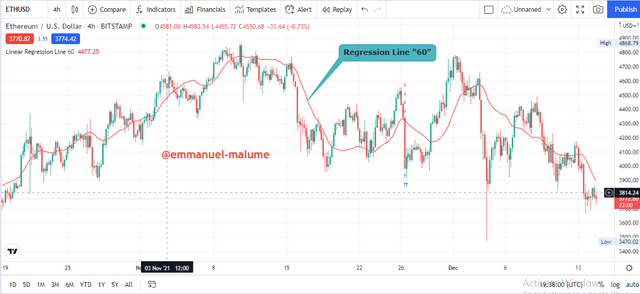
As seen from the image above, we could see the changes we made on the chart by changing its default settings from 14 lengths to 60.Note that this is not advisable for beginners who are just finding their way around with the indicator but expert traders can choose to adjust the base of the settings on the time frame they willing to trade.
Q3. How does this indicator allow us to highlight the direction of a trend and identify any signs of a change in the trend itself? (Screenshot required)
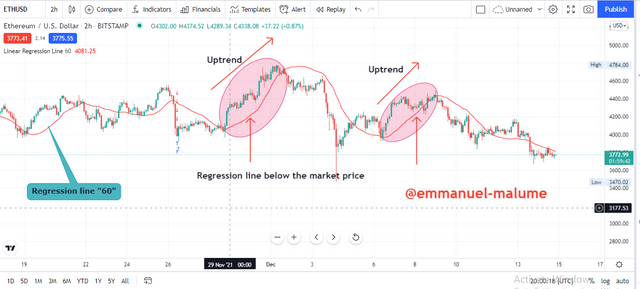
One of the major use of this indicator is to let us know the trend direction in an early stage, we should have these important details in mind when using the regression line is that "the moment the regression line is trending/moving above the market price that signifies to us that sellers are in charge of the market(bearish) and as well when the regression line is moving/trending below the market activity that signifies to us that the market is currently in charge of the buyers(Bullish)".
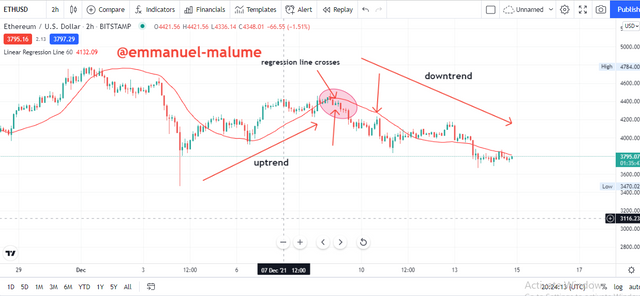
Also, the regression indicator can be used to identify a bearish trend direction which thus can be seen in a situation whereby the regression line is moving above the market activity.image analysis below
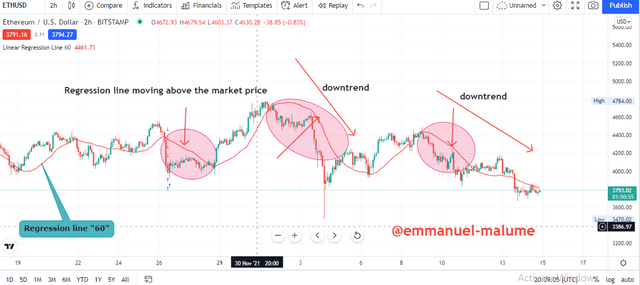
The regression line can as well be used to indicate when a trend makes a reversal just as seen in the image below, the market makes a reversal when the regression line crosses from below to the top as we get to see them move from bullish to bearish after the line crosses the trend.
Q4. Based on the use of price crossing strategy with the indicator, how can one predict whether the trend will be bullish or bearish (screenshot required)
just like have explained earlier that when the regression line crosses above/below the previous that shows a change in a trend.
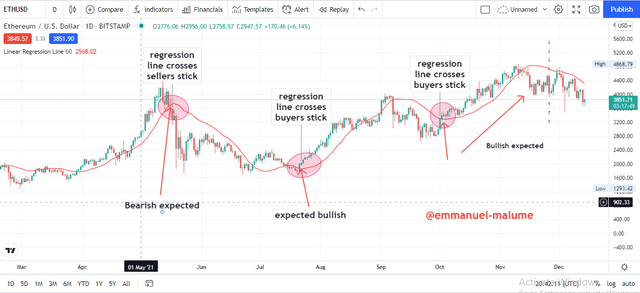
From the image above, we get to see the line crosses multiple times showing bullish and bearish signals. we should note that when using the regression line, the point at which the regression line crosses the sellers stick, we get to see a heavy bullish in the coming signal which same as applied in a situation where the regression line crosses from the top to below and as well crosses the buyer's stick (green) that point thus signifies that there get to be a heavy bullish in the coming days which traders can use this go "Long" to make a profit before we get to experience the line crosses again.
Q5. Explain how the moving average indicator helps strengthen the signals determined by the linear regression indicator. (screenshot required)
The moving average indicator as well works in a similar manner same with the linear regression just that the regression line gives a signal based on complex calculations. Now let us look at the similarity and how the moving average strengthens the signal gotten from the LRI.
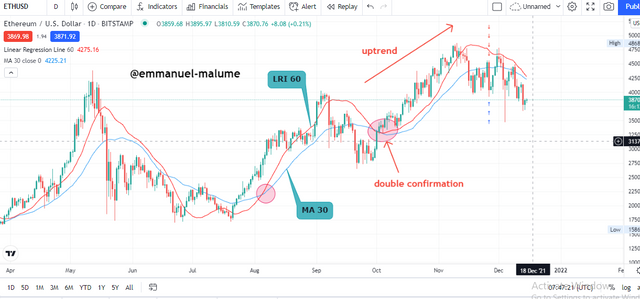
From the image above we get to see how we get to see a clear uptrend signal from the LRI length "60" is combined with the moving average length "30", which the addition indicator depicts to us a perfect entry to buy as we get to see the two indicator moves below the market trend which thus signifies a bullish trend.
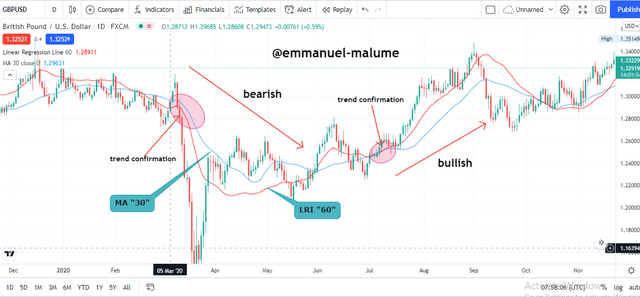
From the image above in the market of GDP/USDT, we get to see the trend correlation between the LRI and MA, just as seen the market moves bearish when the LRI and MA make crosses, and afterward, they head in the same direction next where we get the meetups to move in bullish and bearish from the chart.
Q6. Do you see the effectiveness of using the linear regression indicator in the style of CFD trading? Show the main differences between this indicator and the TSF indicator (screenshot required)
CFD trading means Contracts for the difference which this trading is meant to identify the positioning or predicting of buying and selling of a trade.
Now on this task, I will be showing conjecture of the Linear regression line with the TSF indicator to point to the buy and sell position from the chart.
TSF indicator also known as Time series Forecast indicator works similarly same as the Linear regression as they both give signals based on the previous day's calculation which can then be forecast to see the coming trend positioning. I will be showing the similarities between the LRI and TSF Indicator next.
- Adding the TSF indicator
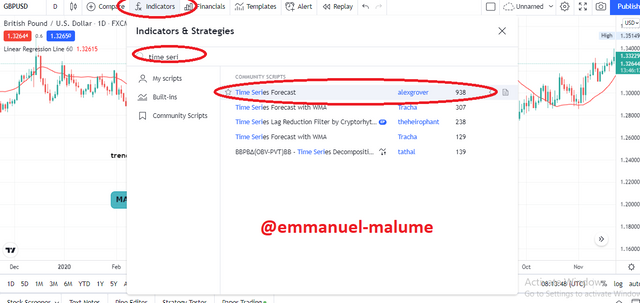
From the image below, we get to see the Time series forecast indicator on the GDP/USDT chart.
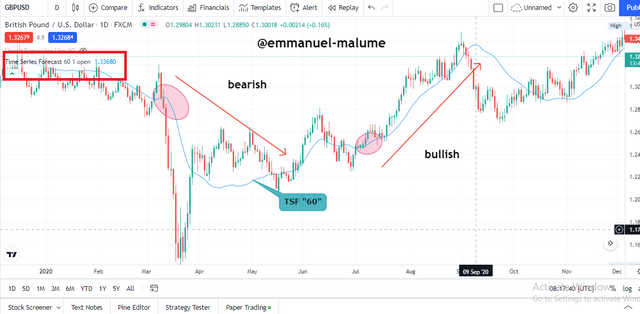
Afterward is the Linear regression line indicator with the same length as the Time series forecast which shows almost no difference that is they both give signals of the same pattern.
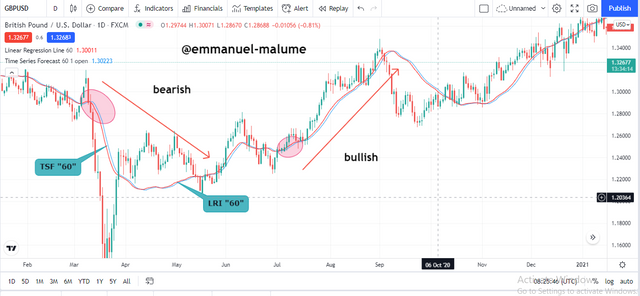
Then from the conjecture indicator, we get to see the two indicator moves in the same manner as the buy and sell signal correlates with the trend. which thus proves that the LRI is almost as same as the TSF indicator.
Q7. List the advantages and disadvantages of the linear regression indicator
Advantages
one of the major advantages of the regression line is that it can help to gain a far more meaningful awareness of the factors that can affect a trend in the coming weeks, and months.
The benefit of the regression line is that it can assist you to do the math to assist you with settling on better choices for your trading decision.
The line also has its advantage in helping traders to anticipate deals in the close and long haul.
It as well depicts the market interest to traders where we get to see the level of buyers and sellers.
The advantage of the regression line is that it very well may be utilized to see a wide range of market information.
Disadvantages
Prone to wrong ideas: This happens in a situation that emerges when the regression line neglects to catch some information properly.
Sensitive: it's been said earlier that the regression line gives information based on data calculation. Data anomalies can harm the exhibition of trade and can give traders a false signal
Not to be used as a standalone: The regression line is best used with other indicators as the indicator data sometimes gives a false signal due to data neglection.
The regression line is an indicator-based trading strategy that can be used to forecast market behavior.
The regression line indicator gives a signal based on the complex calculation been made from the data gotten amongst the buyers and sellers at a particular period.
While the data produced by the regression line might likely be effective, it isn't advisable to use it as a stand-alone indicator as the indicator at times might give a false signal and as well the indicator at times neglect small signal which can tend to give wrong calculations then leads to wrong ideas.
cc:
Professor @kouba01
Thank u so much sir. The I’m grateful, my Achievement2 has not been verified. I don’t know why yet.