Crypto Academy / Season 3 / Week 7 - Homework Post for [@lenonmc21] by @emmanuel-malume
.png)
After a good class from @lenonmc21, he left us with some assignments which are :
Theory (No images)
1.Define in your own words what is the Stochastic Oscillator?
2.Explain and define all components of the stochastic oscillator (% k line,% D line + overbought and oversold limits).
3.Briefly describe at least 2 ways to use the Stochastic Oscillator in a trade.
4.Define in your own words what is Parabolic Sar?
5.Explain in detail what the price must do for the Parabolic Sar to change from bullish to bearish direction and vice versa.
6.Briefly describe at least 2 ways to use Parabolic Sar in a trade?
Practice (Only Use your own images)
1.It shows a step by step on how to add the Stochastic Oscillator to the chart (Indicating the% k Line and the% D Line, the overbought and oversold zone.
2.Show step by step how to add Parabolic Sar to the chart and how it looks in an uptrend and in a downtrend.
3.Add the two indicators (Stochastic Oscillator + Parabolic Sar) and simulate a trade in the same trading view, on how a trade would be taken.

1.Define in your own words what is the Stochastic Oscillator?
The stochastic indicator is an invention of George lane. It was invented in the 1950s and is an indicator that relies a lot on past data to give results. It is actually a momentum indicator that helps us to know how much momentum is in the market depending on market trend and also to identify when the market is oversold (sellers power is gradually weakening or an asset is greatly undervalued) or overbought. (buyer's strength is weakening a lot or the value of an asset is greatly overvalued).

The indicator gives results after comparing closing prices of assets in a particular period to the range of its past prices over a specific period of time. The indicator is an indicator that follows the momentum of rice to give its result.it uses a range of values from 0-100 to give signals and depending on where the stochastic is, we can say whether an asset is oversold or overbought.
The stochastic indicator is made of two lines (%k line and %D line). Lane when he produced the indicator said that the aim of producing the indicator was to give an early signal of market reversal about to occur cause he postulated that there is a change in momentum first before price changes.
HOW IS THE INDICATOR CALCULATED
I am going to be using a formula in which I used certain abbreviations
stochastic =((c.p-l.p)/R.P) X 100
C.P=current closing price
L.P=low for period
R.P=Total range for the period(HIGH OF PERIOD-LOW OF PERIOD )

2.Explain and define all components of the Stochastic Oscillator (% k line,% D line + overbought and oversold limits).
There are two types of lines that make up the stochastic oscillator indicator which is actually two moving averages. These lines are :
-%k line
-%d line
%K line

This is known as the fast line between the two lines and is actually the stochastic line itself cause its calculation is the same as that used in calculating stochastic indicators. It has a continuous line representation and when combined with the other line gives a good signal
%K line =((c.p-l.p)/R.P) X 100
C.P=current closing price
L.P=low for period
R.P=Total range for the period(HIGH OF PERIOD-LOW OF PERIOD )
%D line

This line is drawn by calculating the simple moving average of the %k line and sometimes has a discontinuous line appearance and it is the slower of the two lines
%D LINE= S.M.A X ((c.p-l.p)/R.P) X 100
C.P=current closing price
L.P=low for period
R.P=Total range for the period(HIGH OF PERIOD-LOW OF PERIOD )
OVERBOUGHT

This occurs when an asset is deemed overvalued By traders or should i say when the price has increased past a level where traders feel it's too much. The stochastic indicator shows us this when it enters the 80-100 range on the indicator and when the price is at this level, we often expect a market reversal from uptrend to downtrend cause traders would be trying to push the price down from these levels
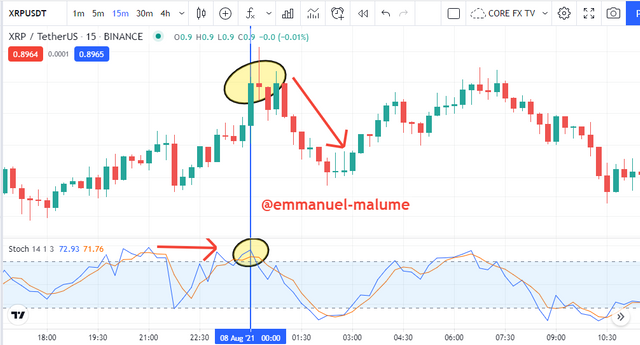
In the xrp chart above, we saw that when the price reached the overbought level, price sold from that point as I explained above cause at these levels the value of the asset is looked at as being too high by traders leading to market reversals and we see it happened in the 80-100 zone
OVERSOLD
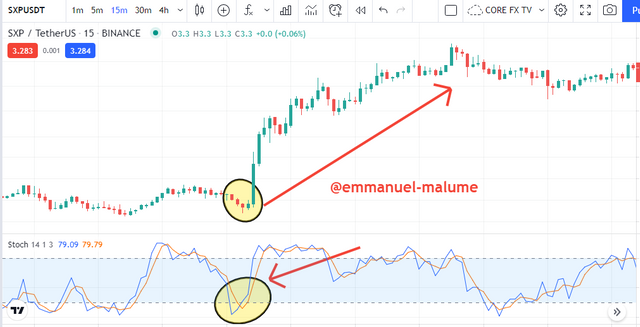
This occurs when the price has fallen below a level where traders feel it's too low or we can say is a level where the amount of strength of sellers in the market has reduced a lot or a region representing an asset that has sold far too long. The stochastic indicator shows this when in the region of 0-20 and often when the indicator is at this level we expect a change in market trend from downtrend to an uptrend.

In the sxp chart below, we saw price reach an oversold level and what happens next, we see a rise in price at this point

3.Briefly describe at least 2 ways to use the Stochastic Oscillator in a trade
TRADING THE OVERBOUGHT AND OVERSOLD REGION
Most traders take trades when they see the indicator move into these zones immediately but we should actually wait for the price to enter these zones and then start leaving before we take entries cause often at times, the indicator can remain in these zones for a long time and so most traders end up being trapped in the trade most times
OVERSOLD ENTRY
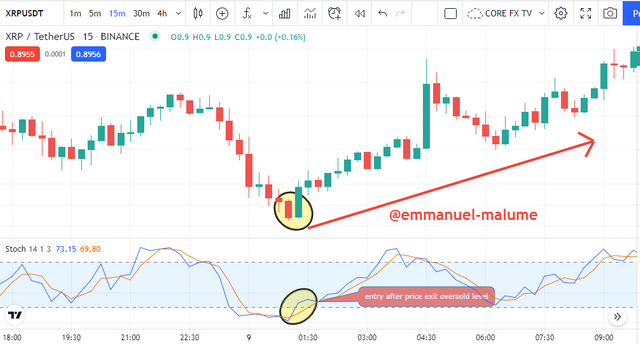
We saw price enter the oversold zone in this example but we wait for the indicator to start exiting the zone before we took our entry giving us a good entry for maximum profit entry
OVERBOUGHT ENTRY
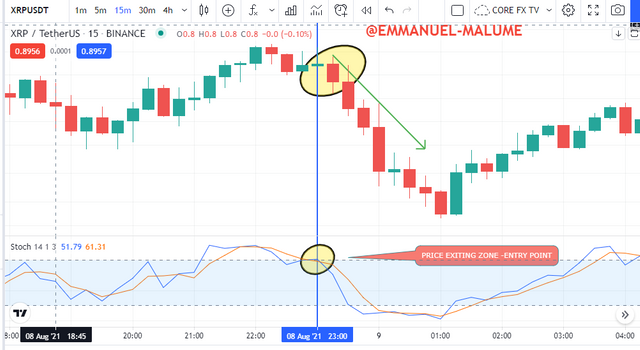
We saw price enter the overbought region which is between 80-100 and then we wait for the price to exit the zone before we took out entry and this gave us a very good entry point for our trade
DIVERGENCE
Divergence in stochastic can be used to take entires in trades when wee price moving in an opposite direction to the indicator we see a divergence, there are two types of divergence, bullish and bearish divergence.
When we see price making higher high but we see the indicator movig=ng downwards, it signifies a potential market reversal to the downtrend cause it tells us that buyers momentum is reducing so this is a bearish divergence but when we see price making lower lows but the indicator is moving upwards, we see a potential market reversal to the upside cause it is showing us that sellers are losing momentum
BULLISH DIVERGENCE
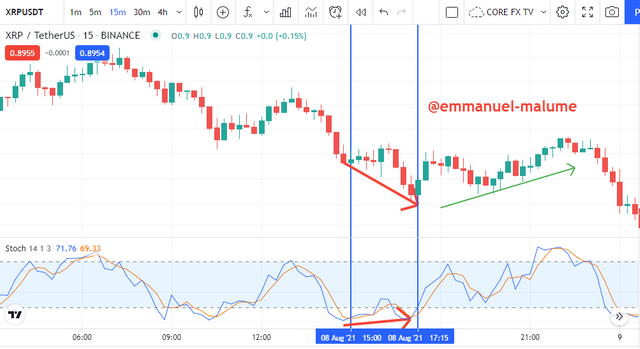
In the xrp chart above, we saw a bullish divergence leading to a rise in price
BEARISH DIVERGENCE
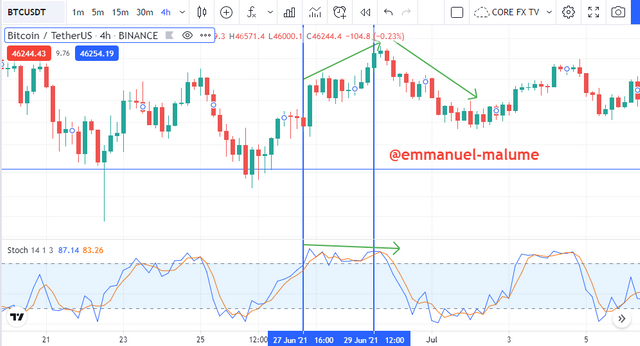
IIn the BTC chart, the price made higher highs while the indicator was making a clear low, we saw a price drop after the appearance of this divergence

4.Define in your own words what is Parabolic Sar?
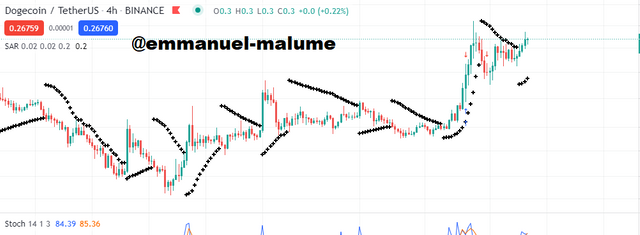
Another product of the father of RSI, J.WELLES WILDER was created for identifying trend direction and for identifying market reversals too. The indicator is actually very good for market reversal detection and even about its name where the SAR means "STOP AND REVERSE ". It has a continuous dot appearance which can either be above or below the price and its position is what is used in determining the particular trend the market is in.
The indicator like most oscillators doesn't work effectively alone so the use of other indicators such as stochastic is advisable to increase its work rate. The indicator is actually a faster version of the traditional moving average indicators cause it signifies trend changes faster than the traditional moving average and also like all trend detection indicators, it works best in trending markets while going lots of false signals in ranging markets.
How to Calculate the SAR Indicator
The indicator also uses past data but this time around gives result by using highest and lowest point of prices with combination with its acceration factors to determine how these dots are presented and the formula for this is presented below:
Uptrend Parabolic SAR = Prior SAR + Prior AF (Prior EP – Prior SAR)
Downtrend Parabolic SAR = Prior SAR – Prior AF (Prior SAR – Prior EP)
source

5.Explain in detail what the price must-do for the Parabolic Sar to change from bullish to the bearish direction and vice versa.
BULLISH TREND
For a bullish trend to be confirmed, we must see the price move from below the indicator to now be above the indicator and this signifies a potential reversal change from a downtrend market to an uptrend market
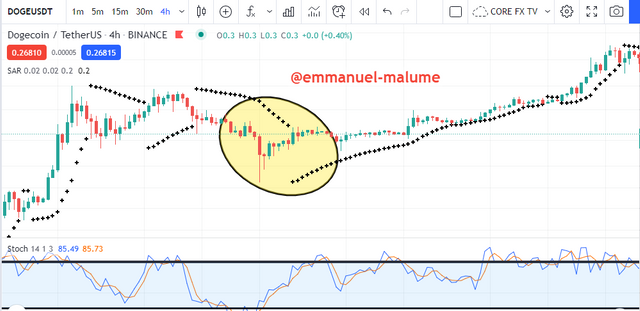
In the doge chart above, we can see price moving below the SAR before a break above SAR to now have the SAR below it and we saw price move up in a bullish direction
BEARISH TREND
For a confirmed market change from a bullish trend to a bearish trend, the price should break through the indicator to move below it and this signifies a potential reversal from an uptrend to a downtrend.
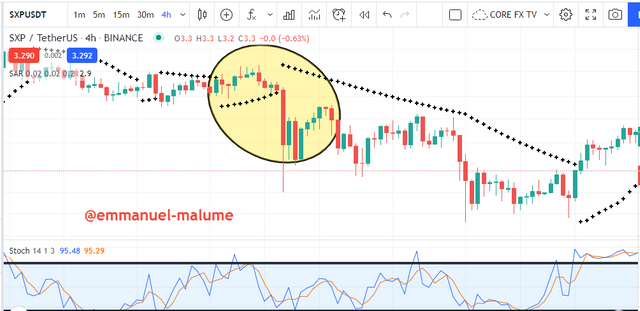
In the SXP chart above, we can see the price was in a good uptrend but upon a movement of price to below the SAR we saw price start moving down in a downtrend

6.Briefly describe at least 2 ways to use Parabolic Sar in a trade?
There are different ways to use the parabolic SAR but I will be talking about two major ways to use it and these ways are:
-Trend detection
-Setting of stop-loss
TREND DETECTION
This is shown by the position of indicator around price whether the indicator is above the price or below to determine the trend the market is in. When we see the price above the indicator we can say the price is in an uptrend while when we see the indicator above the price, we say we are in a downtrend
DOWNTREND
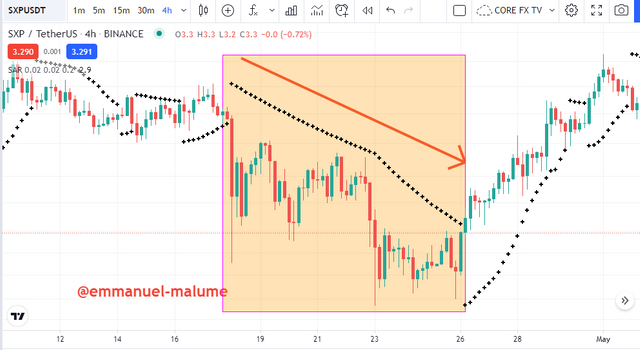
In the sxp chart I marked above, the fact we have the SAR above price told us that we are in a downtrend and we can see price keep moving downwards
UPTREND
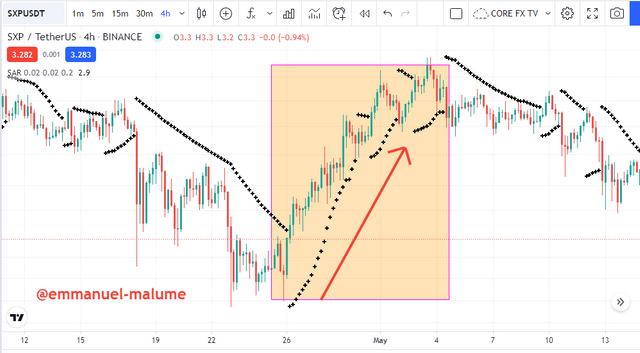
In the same sxp chart, we saw where the Parabolic SAR was below the price and I said it shows us an uptrend and we can see from the chart that when this happens we actually see price moving upwards
STOP LOSS
The parabolic SAR can be used as a dynamic stop loss indicator by using the position of the indicator to set stop loss. Stop the loss of trades in an asset can be placed at the same level as where the indicator is at or below it, the reason is we know a break of these indicators below or above we can say we might see a market change soon
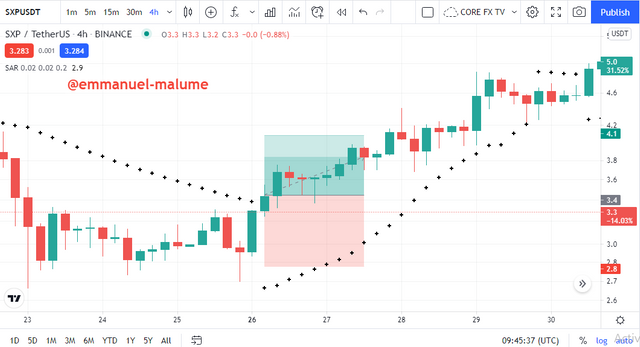
In the sxp chart, after a break above SAR to now enter an uptrend phase, one can take the trade and then place his stop loss below SAR for an early exit from the market when the market goes against our analysis cause the market can always change direction any time it wants


1.It shows a step by step on how to add the Stochastic Oscillator to the chart (Indicating the% k Line and the% D Line, the overbought and oversold zone
1.Firstly we go to the site Trading view and click on charts
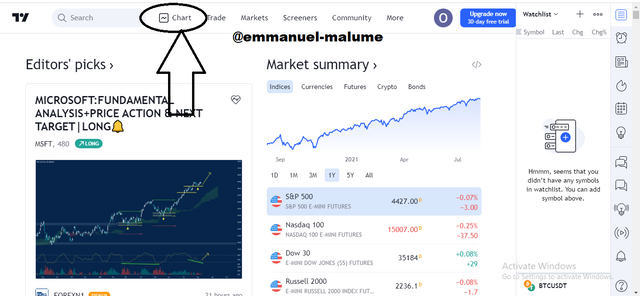
2.Click on the f sign and we see an indicator list dropdown

3.I now searched for a stochastic indicator which I then clicked on
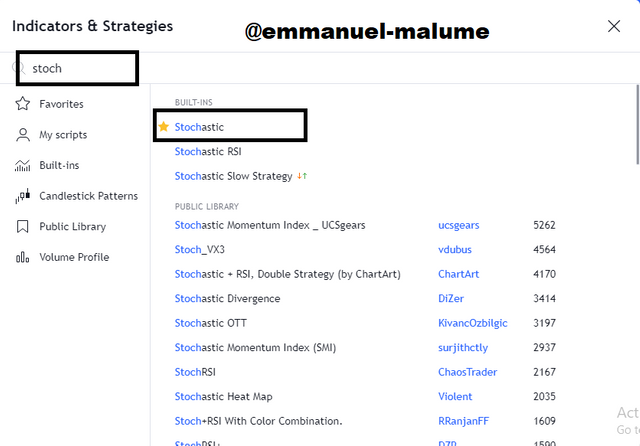
4.The chart would no appear like shown below
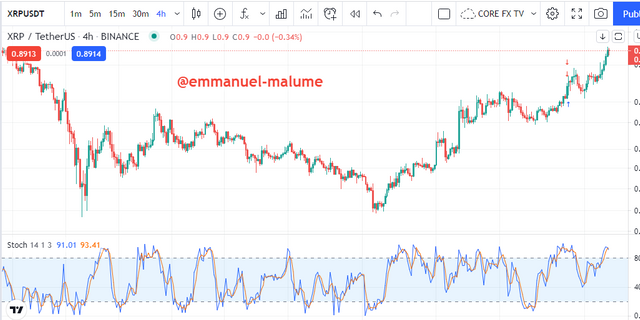
5.I now marked out the necessary parts of the indicator below
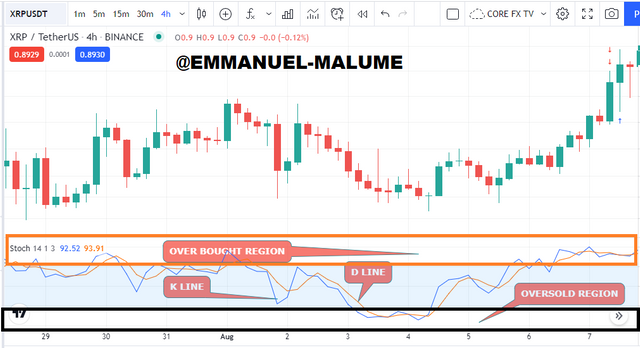

2.Show step by step how to add Parabolic SAR to the chart and how it looks in an uptrend and in a downtrend
1.Firstly we go to the site Trading view and click on charts

2.Click on the f sign and we see an indicator list dropdown

3.I now searched for the indicator which is parabolic SAR which I now clicked to load it on the chart
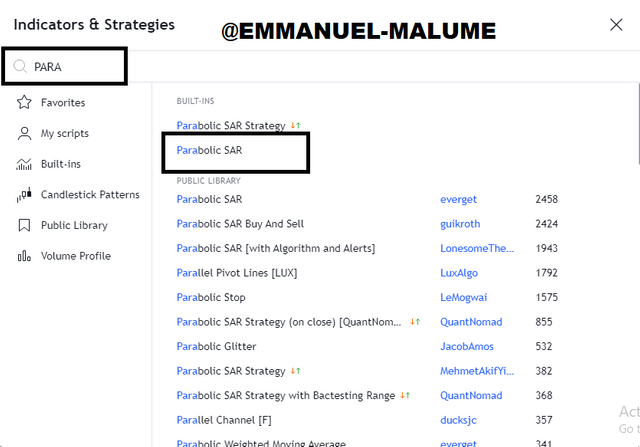
4.The chart appeared like this below
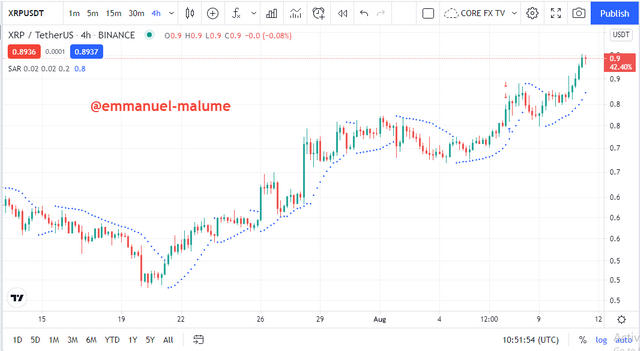
5.I will identify an uptrend first by I will zoom the chart so we see it better and now we look for an area where the indicator is below price and let's see what is going on there
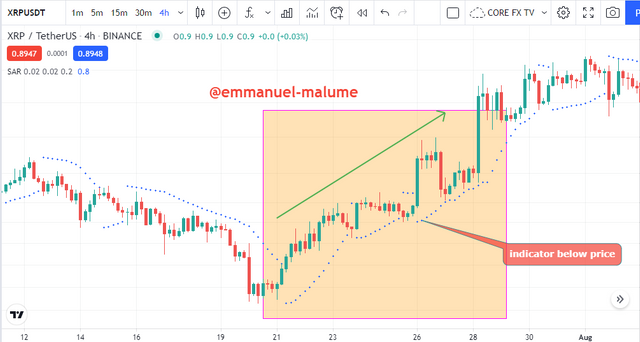
We can now see that when the indicator is below price we get an uptrend
6.For a downtrend, we zoom again and then look for where the indicator is above price and see price direction
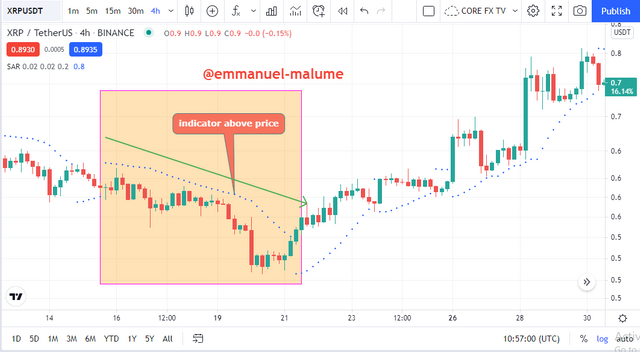
We see that when the indicator is above the price we get a good downtrend

3.Add the two indicators (Stochastic Oscillator + Parabolic SAR) and simulate a trade in the same trading view, on how a trade would be taken
Following the steps, I stated above we can add the two indicators together and the chart would look like this below
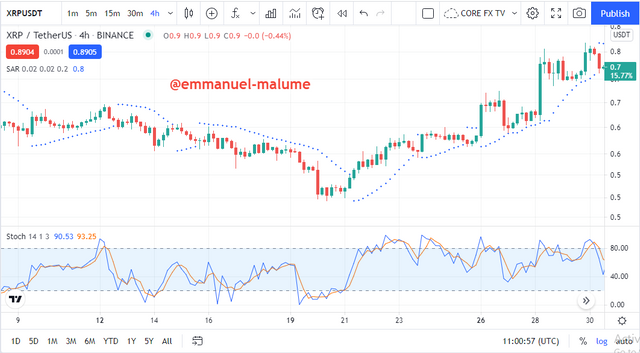
We now look at the strategy for trading these indicators together and the steps before we make a trade with these two together are:
1.The position of the parabolic SAR would help us check for the current trend the asset is in
2.Then we look at the zone our stochastic is in, if it is in an overbought zone, we look to sell but in oversold, we look to buy
So when these two signals are pointing at the same trade, we have a confluence which we use to take the entry
Example:
BUY ENTRY
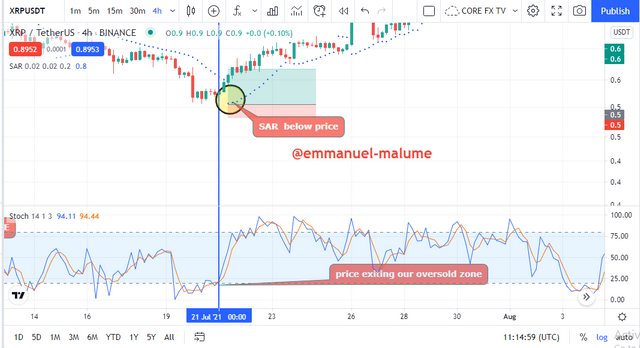
In the chart above, we first saw the stoch indicator leaving the oversold zone then followed by the parabolic SAR been broken by price to now be below price giving us a good buy entry and we saw price move up from this point and then we set our stop loss below SAR and then we use proper risk management of minimum 1:1 for the trade
SELL ENTRY
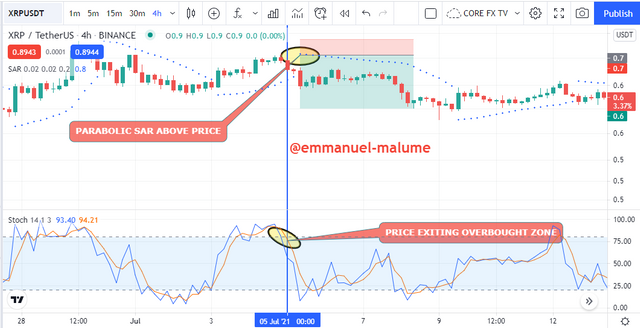
In the chart above, we saw price exit the overbought zone and then price breaking the parabolic SAR to move below the indicator confirming a sell trade, we can now take the trade from there using above the SAR as a stop loss point. Always use good risk management of 1:1 at least

CONCLUSION

In this class we learn about two very important indicators which are the parabolic SAR and stochastic indicator where one is a momentum indicator and the other for identifying trends and then the other helps in showing how to determine trend . These indicators when combined together can give us good entries for taking trades and the parabolic SAR helps in setting stop loss for trades to avoid liquidation from one trade
cc:@lenonmc21