Crypto Academy / Season 3 / Week 7- Homework Post for [@kouba01] | Trading Crypto With Average Directional Index (ADX) Indicator
.png)
Welcome all to another assignment to be submitted for @kouba01 for his wonderful class on the indicator, ADX.these are the questions we are to answer below
- Discuss your understanding of the ADX indicator and how it is calculated? Give an example of a calculation. (Screenshot required)
- How to add ADX, DI+, and DI- indicators to the chart, what are its best settings? And why? (Screenshot required)
- Do you need to add DI+ and DI- indicators to be able to trade with ADX? How can we take advantage of this indicator? (Screenshot required)
- What are the different trends detected using the ADX? And how do you filter out the false signals? (Screenshot required)
- Explain what a breakout is. And How do you use the ADX filter to determine a valid breakout? (Screenshot required)
- What is the difference between using the ADX indicator for scalping and swing trading? What do you prefer between them? And why?
- Conclusion:

1. Discuss your understanding of the ADX indicator and how it is calculated? Give an example of a calculation. (Screenshot required)
ADX is an indicator that has been in existence since 1978 that was used originally for stocks and is one of the inventions of J.WELLES WILDER, the father of RSI. ADX actually stands for average directional index. The aim of creating the indicator was not to tell market trend or direction but rather when we identify a trend in the market, is the trend strong enough for one to trade it? It Is this question that the indicator was created to answer
ADX is an indicator that helps one eliminates the case of entering weak trends or ranging markets cause every trader's favorite market type should be a trending market. The fact it is trying to measure the strength of a trend makes it a very good lagging indicator cause a trend has to start first then the indicator tries to determine how strong the trend is
STRUCTURE OF ADX
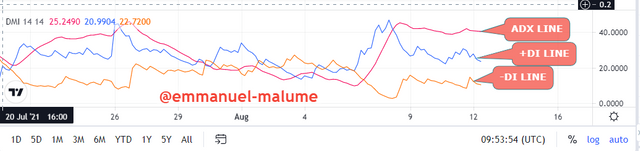
ADX indicator is actually a single-line indicator that can be any color depending on what you want. The ADX indicator can appear independently on its own ADX indicator is actually derived from 2 independent indicators which are combined and the results from these independent indicators are then smothered to get the ADX indicator itself. The independent indicators are; positive directional indicator(+di) and the negative directional indicator (-di). When these two indicators are used together with the ADX we have the directional movement system indicator
When the indicator is with the positive and negative directional movement indicator to form the directional movement indicator we have this below:
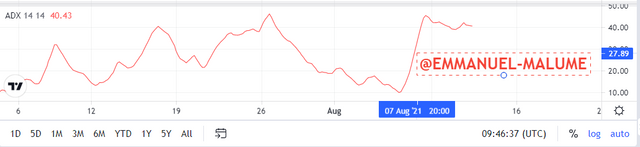
The indicator has a range of 0 to 100 which has different range values for certain trend strengths of the market. The ranges are:
0-25- no trend in the market or a weak trend
25-50-trend is in the market
50-75-a very strong trend is in the market
75-100-A very strong trending market
What these ranges mean is that when ADX is below 25, we may have a trading market but this trend does not have enough strength to sustain the trend. so in taking trades, 25 is a key level for traders
HOW IS ADX CALCULATED
To get ADX, we need to calculate for positive directional indicator(+di) and negative directional indicator(-DI) independently before smothering the result. What is needed for the calculations are;
1.Data of high and low of each period
2.Closing data of each period
CALCULATION
We get the positive and negative directional movement first
1.We get the positive directional movement (+DM)/upmove =current high - previous high
2.We get the negative directional movement (-DM)/downmove =current low -previous low
Next, we get the true range of the asset, this is done by picking the highest value gotten from the calculation below:
current high-current low=z
current high-price of the day = l
current low-previous close=h
TRUE RANGE-[[Z,L,H]. The biggest number among them becomes true range
positive indicator
(+DI)= +dm / True range
negative indicator
(-DI)= (-DM))/True range of a given period
Finally for ADX;
Then we get DX=100 X ((DI +) - (DI-)) / ((DI +) + (DI-)) FOR a period, so to get ADX we take the average of dx of a certain amount of periods
ADX= Sum of n [((DI +) - (DI-)) / ((DI +) + (DI-))] / n
Also note that we can also use exponential moving average, weighted moving average, or adaptive moving average for the calculation
Sample question using the following values :
current high =50
current low=41
price of the day=48
previous high=47
previous low =44
Previous close-40
+dm=50-47=3
-dm=41-44=-3
so,+dm-3,-dm=-3
TRUE RANGE
TRUE RANGE-[[Z,L,H]=(50-41),(50-48),(41-40)=(7,2,1)
TRUE RANGE =7(HIGHEST VALUE FROM ABOVE)
+DI=3/7=0.428
-DI=-3/7=-0.428
DX=100 X ((0.428) - (-0.428)) / ((0.428) + (-0.428))=100
TO GET DX WE USE MORE ADX , LETS CHECK FOR 3 PERIODS WHERE OTHER DX ARE 70 AND 40 RESPECTIVELY,
ADX=Sum of n [((DI +) - (DI-)) / ((DI +) + (DI-))] / n=(100+70+40)/3=70
ADX = 70 ( A VERY STRONG ASSET TREND
2.How to add ADX, DI+, and DI- indicators to the chart, what are its best settings? And why? (Screenshot required)
The following steps would be taken to load the indicator on the chart
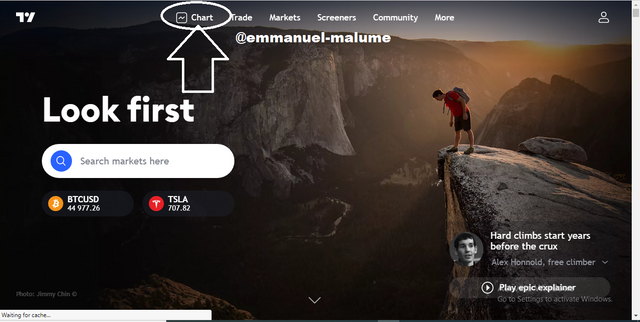
1.Go to trading view
2.click on the indicator sign which is an f sign above
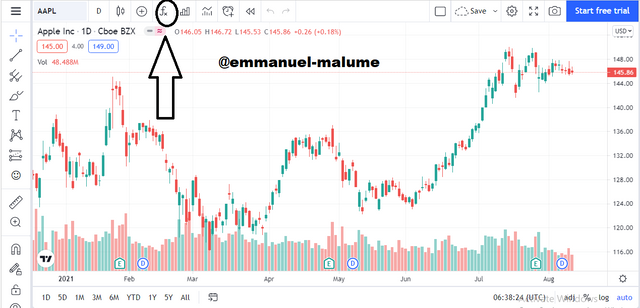
3.A drop-down box appears where we type in directional movement index instead of average directional movement indicator, The reason is this, when we search for average directional movement indicator, we get only the ADX but when we search for directional movement index we get both the ADX and the (+di ) and (-di) line together
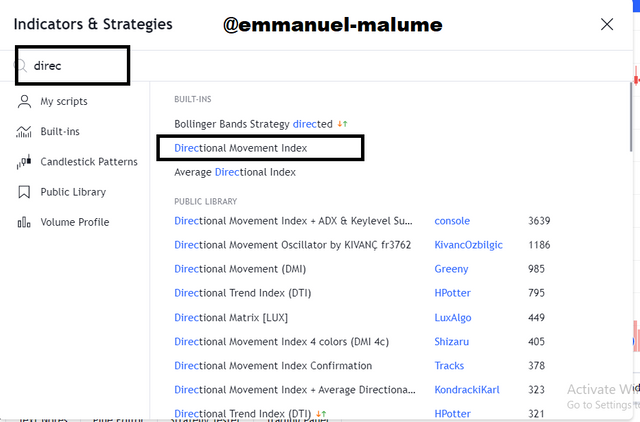
4.The indicator now appears as below
CONFIGURING THE INDICATOR
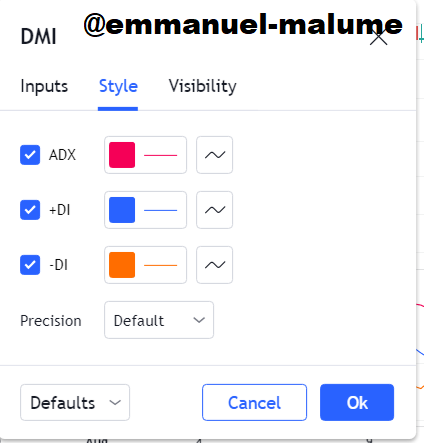
1.When we go to a setting by clicking the setting icon near the indicator name, we can see the different changes one can make to the indicator, lets start from the style which is color. Looking below, we can change the color to our preferred color but I will be leaving mine like this
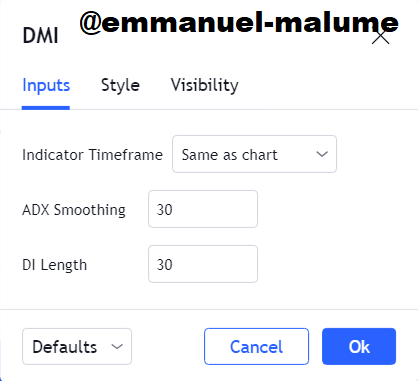
2.Then we go to inputs. This is where we can change our periods for both ADX line and (di) lines to your preferred setting, I will be changing mine to 30 cause it is most advisable to use
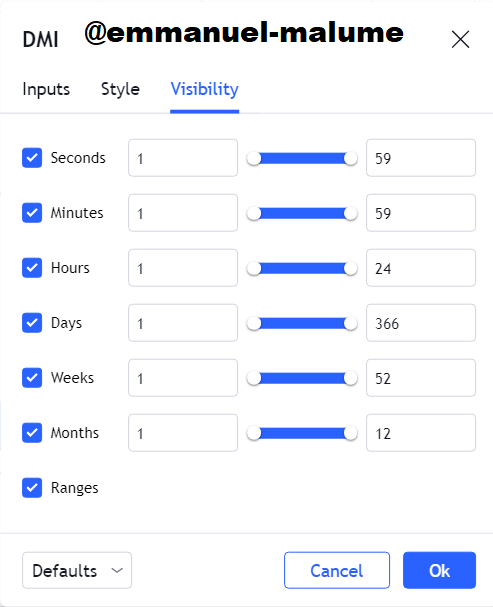
3.For the visibility setting , here we choose the time frames we wish to see the indicators at, but we will be leaving it at default for now
In changing the settings of the indicator, we are changing the periods of the indicator. In changing the period, we are changing the range of concentration of the indicator. The period determines the focus of this indicator, if its period is set to 20, its concentration will be on the last 20 periods or candles in producing the result.
We know that usage of higher time frames helps eliminate more often than not, useless small noises in the market, the indicator doesn't react to small noises which cause lots of errors in the signal. The same applies in using this indicator, usage of higher timeframe periods is preferred so that one reduces the number of wrong signals which occur when small periods are used since these small periods tend to pick up all the small noises in the market
FOR SMALLER PERIODS
When we use 8 as our period let's look at the chart below
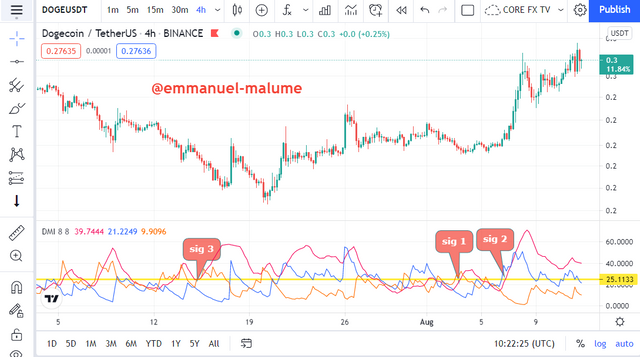
We see the giving various amount of signals even though it is on a higher time frame, it still picks out noises in the market
FOR HIGHER PERIODS
We will be using 30 for this question
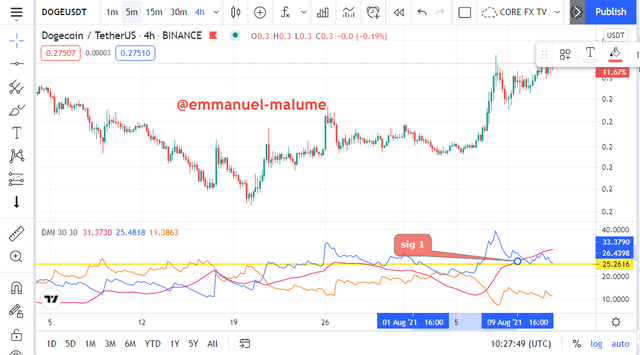
In this larger period, we saw price give us only one sign of the market bringing a goo trend, which shows us the clear effect of changing periods
3.Do you need to add DI+ and DI- indicators to be able to trade with ADX? How can we take advantage of this indicator? (Screenshot required)
Actually, you don't need to but having them helps improve one's decision-making when reading the ADX indicator. The positive direction indicator actually shows the trend strength of the rising market while the negative directional indicator shows the trend strength of the negative or decreasing trend market. This leads to the reason why most times if the positive directional indicator is above we see the market rising and if the negative directional indicator is above we see a falling market. The main reason this indicator is good is that these indicators are actually independently making them react faster than the ADX line which is a composite indicator derived from the two.
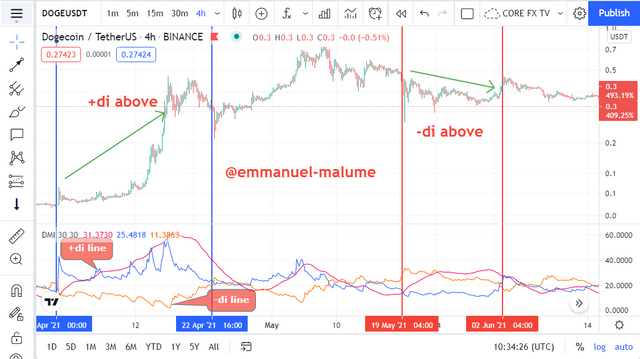
We can see this in this chart above, that based on the position of those two lines, we can get more trend information too. Wait, this doesn't mean when we see (+di) cross to above we buy and when the (-di) crosses above doesn't mean we should sell, using this indicator like this is a very wrong approach and gives wrong signals do we use the indicator only as a trend strength determinant as it is meant to be
Also, the gap between these two lines helps show trend strength. The wider the gap, we see a significant increase and rise in the ADX line itself.
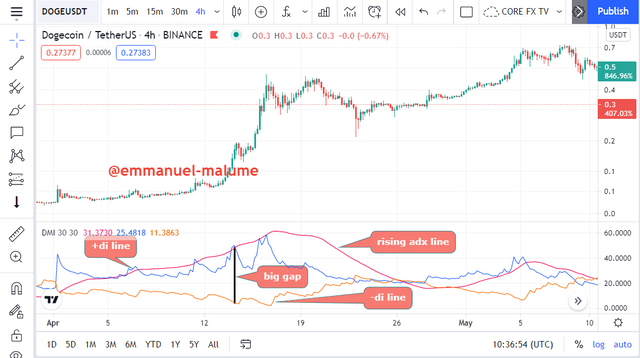
Looking at the doge chart above, we can see a clear implication of the gaps between these two lines and what it reflects on the adx line
4.What are the different trends detected using the ADX? And how do you filter out the false signals? (Screenshot required)
The ADX actually measures trend strength;
1.Weak trend or neutral trend@
2.Strong trend
3.Very strong trend
4.Extremely strongly trend
The ADX range is 0-25
In this market scenario, we are looking at a market where buyers are equal sellers. There is low volatility in the market which is a sign of low strength in the trend to push the market. No party is pulling the show here. We often see a consolidation market when the ADX is showing these weak trends. Actually, this type of market should be avoided once detected so once we see the ADX indicator dropping into the 0-25 range, it is good to exit the already existing trend cause the indicator is telling us that the strength that was pushing the indicator is already exhausted or is no longer there. So its good o wait for indicators to leave these zones before taking entries
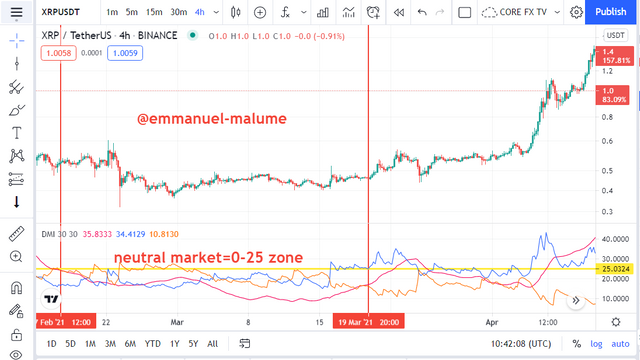
Above we saw what happened when the ADX was in the neutral zone, we saw a market that was almost trendless as in it was in the consolidation phase
ADX range-25-50
ADX in this range or just entered this zone from the neutral zone shows that there is a trend in the market at least but not there is either an uptrend or downtrend cause that is not the function of ADX. So all we know is that there is a trend.
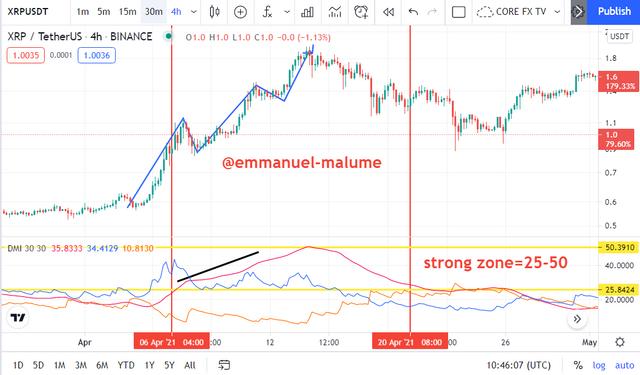
When the ADX line moved into the 25-50 zone, we were able to see a clear trende occur and this time we are seeing clear higher high for the uptrend
ADX RANGE-50-75
A very good place to see marketing. it means that when the ADX is in this range, we have a very strong strength pushing the current market trends, and it's a good place to be. The volatility here is much and the trend is strong leading to constant breaks of support and resistance levels.
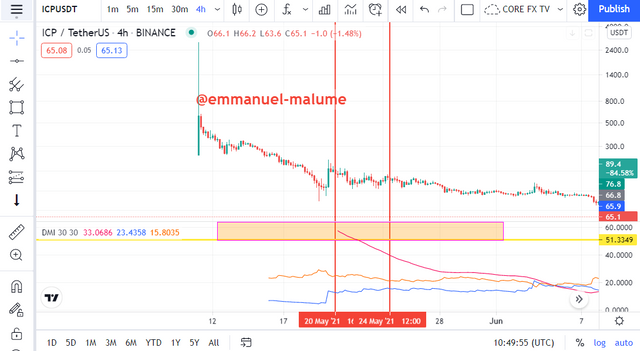
In the chart above, we saw how the price was pushed down very well when in that zone showing how much strength in the market when ADX was in that zone
I call it the news range. Here we see the market reacting to certain news released in the market and it's advisable not to trade her if you are inexperienced cause the market can move in any direction at this zone. It is actually a rare occurrence so it is very hard to locate this on our charts
How do you filter out false signals with ADX?
Firstly, the use of proper periods plays a great role in helping one filter out noises or wrong signals using the ADX. like I said above, using certain periods is detrimental to one's trading skills especially using those smaller periods which gives many but lots of false signals.
Secondly, we can use the formation of higher highs or lows on the ADX as a way to understand what is going on in the market. When we see a market be It uptrend or downtrend and we see ADX rising, We should see this as a reflection that the market is in a good position to trend well but when we see a market that has been trending for a long time and suddenly we see the ADX making lower highs, it is good we start monitoring the trades closely or exit cause most times, we see the true die off and enter consolidation and reverse. Please I didn't say use this as a trend reversal signal
5.Explain what a breakout is. And How do you use the ADX filter to determine a valid breakout? (Screenshot required)
A breakout can be defined as an exit from a consolidation phase or when a market breaks through very strong support and resistance zones or levels either in the direction of the market or in a new direction. For a good breakout to occur we need to see price break out of range through support and resistance with enough volume or strength. A breakout can happen in any direction, be it to the upside or the downside
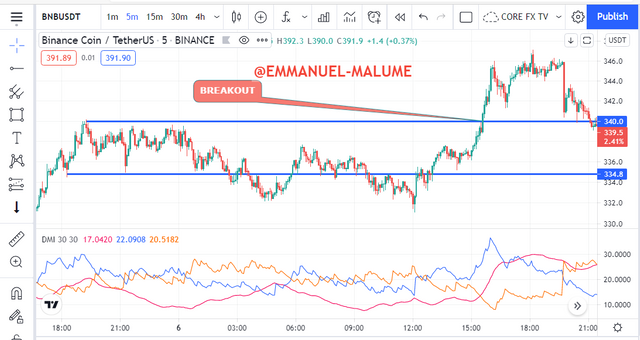
Above we can see a breakout to the upside from the range. Did you notice the kind of candle that broke the range, a very strong bullish candle which represents a strong volume in the market to cause the break
How do you use the ADX filter to determine a valid breakout?
ADX is an indicator that shows how strong a trend is or the amount of strength in the market and this strength is related to the number of buyers and sellers in the market so when we see there ADX signifying strong trend(>25) and then we see a breakout, we can confirm the breakout as a strong and good one but any break below 25 is not good enough for one to take entries from.
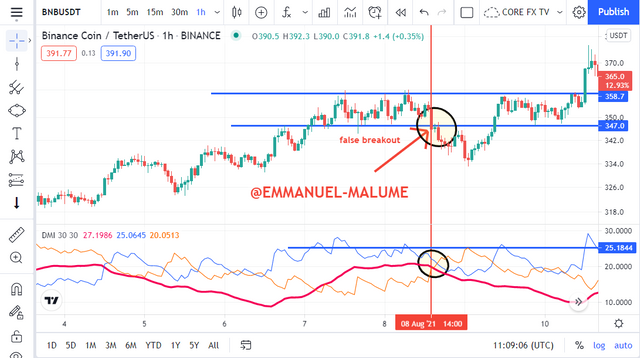
We look at this chart above and we see how the ADX would have helped someone avoid a false breakout. The price of the asset did breakout out of the range but we saw the ADX was below 25 signifying low strength in the market telling us that the breakout won't last and we saw market return back to range eventually
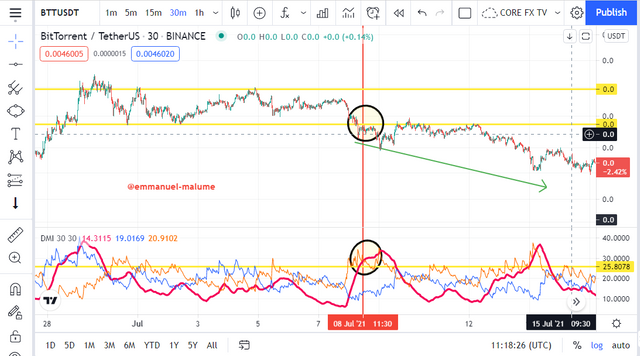
In the chart above in BTTUSDT, we saw price breakout out of the range it was with our ADX above 25, it showed a sustainable brEak and we saw price keep moving downwards
6.What is the difference between using the ADX indicator for scalping and swing trading? What do you prefer between them? And why?
| Scalping | swing trades |
|---|---|
| any indicator can be used with it here eg: RSI, ICHIMOKU, etc | only two indicators should be added to the ADX for effectiveness, and these indicators which are the pivot point indicator and Ichimoku |
| 1min and 5 min timeframe is advisable for scalping purposes | Medium time frames are used .eg:4hr and 1hr timeframe |
| the period is set to 100 to be able to note a dominant trend in the particular time frame | .period can be set to anyone wishes although anything above 30 is not advisable |
I prefer swing trading cause first the less amount of indicators needed to trade makes my chart not be all crowdy and messy and the fact when one swing trades. he or she doesn't have to spend a lot of time in front of the screen when trading swing trades but when scalping you have to sit there and watch the trade or risk losing your capital in a split of a second and I have seen lots of my friends lose their capital due to scalping in less than 5 minutes cause they just took a toilet break. Also, the ADX can perform its real function more perfectly in swing trades too

CONCLUSION
In this class, we learned the several uses of the ADX indicator and especially understanding the main purpose of its creation which is to show us the strength of the trend in the market currently, whether it is a good one or a bad one. We also learned about the lines from which it is derived and how to get the calculations and also how we can use the indicator to swing trade and also scalp
thanks, @kouba01 for the nice lecture
Hello @emmanuel-malume,
Thank you for participating in the 7th Week Crypto Course in its third season and for your efforts to complete the suggested tasks, you deserve a 10/10 rating, according to the following scale:
My review :
Very excellent work which covered the subject in all its aspects in a superb manner and with a solid methodology. Most of the answers were precise and direct, which confirms your good understanding of the questions asked.
Thanks again for your effort, and we look forward to reading your next work.
Sincerely,@kouba01
Wow what a detailed guide thanks https://9blz.com/adx-indicator-explained/