Crypto Academy / Season 3 / Week 2 - Homework Post for professor @yohan2on


1. What are Fibonacci Retracement levels?
Support and resistance can be seen in different trade tools from using zones to lines to using moving averages. There is another one known as a Fibonacci retracement. Fibonacci retracement is the psychological level of potential market reversal
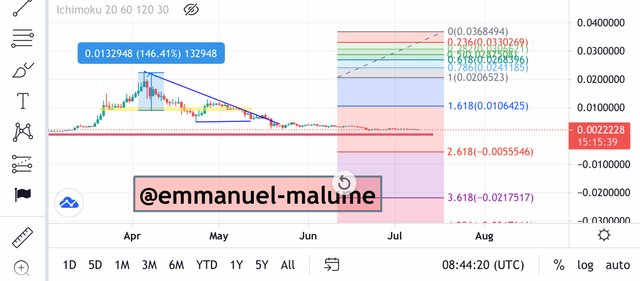 IMAGE OF A FIBONACCI TOOL ON TRADING VIEWsource
Before talking about Fibonacci retracement, let us talk a bit about its history. Fibonacci is actually an ancient mathematician who lived many years ago and came up with some numbers known as Fibonacci numbers.
Fibonacci retracement combined lines with values known as Fibonacci levels. Fibonacci retracement tool like the name is used to identify the end of retracements or corrections in the market.
Fibonacci levels are formed in a particular sequence where the current number is added to the previous number to get the new value : 0, 1, 1, 2, 3, 5, 8,13, etc. These numbers are also called magic numbers.
In Fibonacci trading the levels used is 23.6%, 38.2%, 50%, 61.8%, and 78.6%. Let's look at how some of these levels are gotten.
0.618-This value is gotten when a magic number is divided by its preceding number and inverted
0.382-This is gotten when a number is divided by two numbers in front of it
These two levels are actually used in nature but we are talking about trading so let's continue
Most traders look out for retracement at 50% and 61.8% cause it often acts as strong support or resistance for a retracement.
The market doesn’t move in a straight line but rather waves where corrections appear. The use of Fibonacci levels applies only in trending markets where there is a clear direction of the market.
Fibonacci levels are not used alone for some reasons, they provideprobability levels that may or may not happen so one needs extra tools to help him or her trade well and risk well. Tools that should be used together with guns are :
- Moving average
- Market structure
- RSI
- Support and resistance levels

Uses of Fibonacci levels
⁃ They identify possible reversal points in the market (entry points): The use of these levels which are potential support and resistance aid in making entries cause they are seen as points where an already existing trend continues
⁃ They help in putting stop losses- if you can identify your support and resistance zone using them, one can comfortably put his or her stop losses below this zone in case of validation
⁃ Set price targets using fib extension: take profits are also determined using this strategy where the extensions do this work perfectly well
NO 2:Practically demonstrate your understanding of the Fibonacci retracement levels using a Crypto trading chart of your choice. (Use trading view)
Before I show my charts I would love to explain how to draw fib levels cause you can’t be looking at my chart and not know how I got to position it like that. First of all, let's get the fib tool and put it on our chart. We are using trading view for this function.
1.we open the sitetrading view
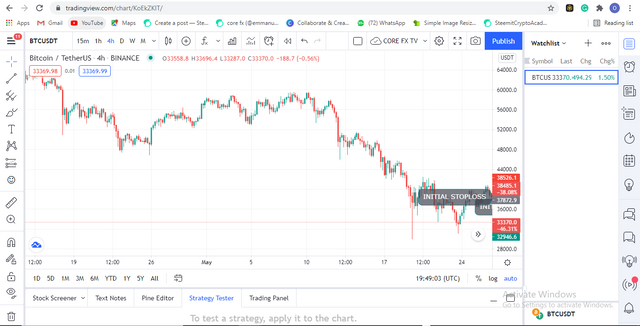 SCREENSHOT FROM TRADING VIEW
2.we click on the Fibonacci retracement tool
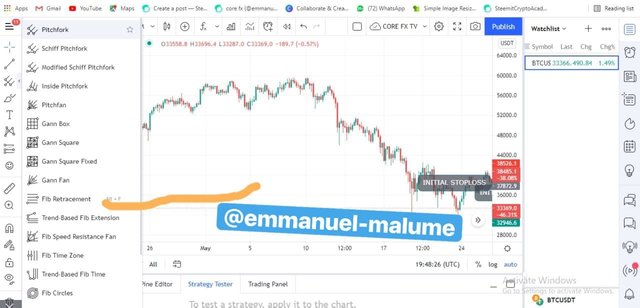 SCREENSHOT FROM TRADING VIEW
How you plot the Fibonacci retracement levels on the chart.
In the plotting of the Fibonacci tool on charts, we are going to use certain levels which are: plotting of Fibonacci on a chart has two methods, one for uptrend and the other for the downtrend. I did mention this before but now we take it part by part.
In an uptrend market, previous lows and current highs are used for this process. let me guide us on how to draw the Fibonacci tool on an uptrend
1.For an uptrend: a fib level is drawn from a previous low A to current high B
SCREENSHOT FROM TRADING VIEW
2.For a downtrend: a fib level is drawn from the previous high A to the current low B
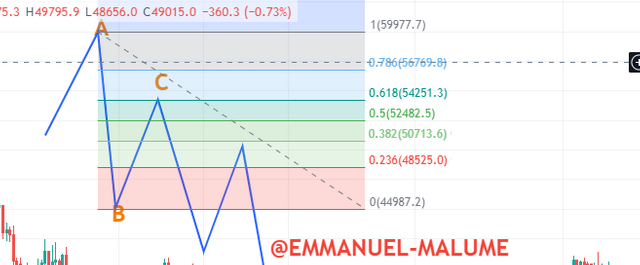
SCREENSHOT FROM TRADING VIEW
ENTRY AND EXIT STRATEGY
Getting good entries in trading and good exit point helps make highly profitable trades. The Fibonacci trading tool helps with this when combined with price actions like candlesticks pattern to get it
UPTREND
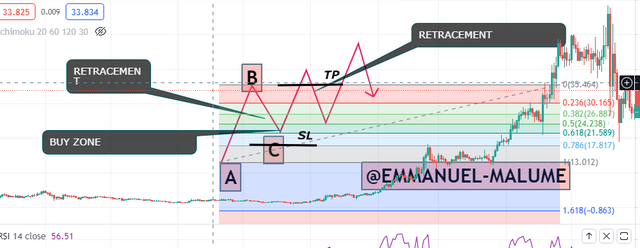
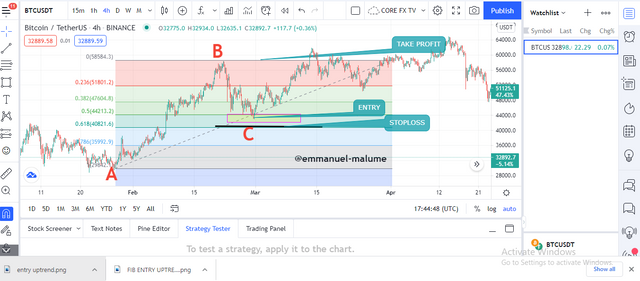
To draw Fibonacci on an uptrend, one should identify previous low(A) and recent high (B)and taking the Fibonacci from that previous low to the high. Then you watch price action at the fib levels especially at 50% OR 61.8% at point C and then see if price rejects then you enter with your stop loss put at the next fib level below. In this example we saw a tweezer bottom formed at 61.8% level, which is a good price action in form of candlestick to take the entry and buy
 SCREENSHOT FROM TRADING VIEW
DOWNTREND
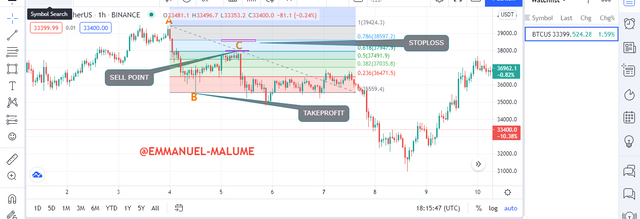
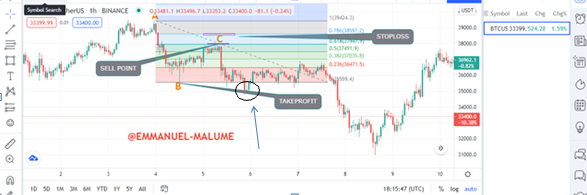
For a Fibonacci on a downtrend , we can trace price from point A which is a previous high to the recent low B, and then wait for price actions at the Fibonacci levels and n the example we saw below, price formed a bearish engulfing at the 61.8% level so we take a sell setting stop loss at the next fib level above since its a downtrend
SCREENSHOT FROM TRADING VIEW
TRADE MANAGEMENT
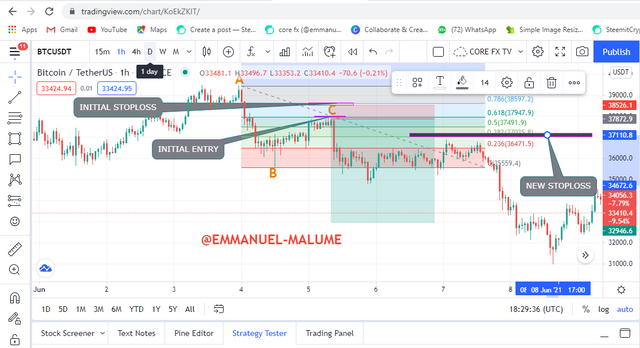
In trading, the aim is to maximize profits by not exiting winning trades too early and not returning one's earnings back to the market. one of the ways to do this is to use a trailing stop loss. Trailing stop loss is the act of adjusting one's stop-loss when one is deep in profit while allowing the trade to run freely. we can do this using fib levels or market structure by adjusting stop loss using the fib levels.
In trading stop loss, there is no take profit. Rather we adjust stop loss and as we can below we just moooved the stoploss
 SCREENSHOT FROM TRADING VIEW
OTHER INDICATORS
other indicators used with Fibonacci, there are lots of indicators one can use together with it and we have moving average, MACD, RSI, stochastic.
i will be picking one of the indicators to show one can use it together with the fib. We will be using the 50 moving average for this example. A moving average can be used to identify support and resistance levels so when the price on approaching a moving average and we see a rejection from the moving average combined with the Fibonacci levels we confirm the retracement at 61.8% level, we confirm the entry and set up our stop loss
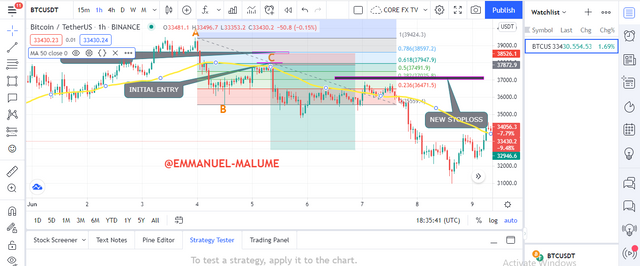 SCREENSHOT FROM TRADING VIEW
This tool is a very important tool for trading that can enable us to identify ends of retracement or correction, take good entries when combined with other indicators. It is a very useful tool to actually use especially in the trending markets where it works the best.
Another important thing to note is don't trade Fibonacci level alone.I thank @yohan2on for this lecture on Fibonacci.
Hi @emmanuel-malume
Thanks for participating in the Steemit Crypto Academy
Feedback
This is good work. You correctly plotted the Fibonacci retracement levels on the charts and demonstrated how to use them in trading.
For the take profit, you had to correctly demarcate where it is set. Check the circled area. That's where you were meant to set your take profit.
Homework task
7