REPOST !!!! [Crypto Trading With Alligator Indicator]- Crypto Academy /S5W3-Homework Post for kouba01
@emmanuel-malume · 7 days ago

Here is above screenshot to my score on the assignment and the link to the assignment
.png)
Hello eveyone, How have you all been doing? Welcome to the third week of the Crypto Academy.
Here is my submission to the homework task given by professor @kouba01 , on the topic [Crypto Trading With Alligator Indicator] . READ ON!!

Question 1 - Discuss your understanding of the use of the Alligator indicator and show how it is calculated?
Technical indicators are fundamental instruments that assist traders with foreseeing future cost of monetary resources. These indicators are made utilizing complex measurable formulae.
In this task, we will check out the fundamentals you really need to know to have some familiarity understanding on the William Alligator Indicator.
The Alligator indicator is one of the few indicators, that were created by Bill Williams, and utilizes 3 lines which are moving average lines.
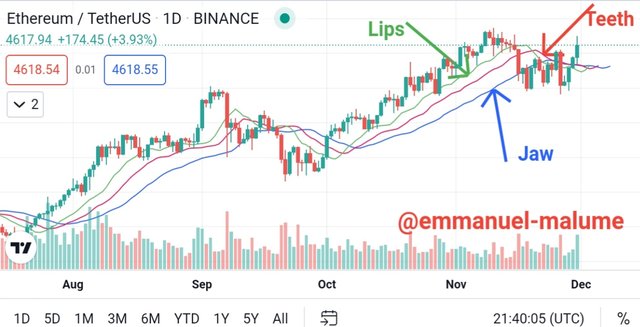
At the point when applied, the Alligator indicator has three lines. AT default, the three lines are Known to be in red, blue, and green. Where the red line is known as the Alligator teeth while the blue line is the Alligator jaws and as well the green line is known as the Alligator lips.
From those states, a trader can decide whether a market will be in a ranging positing and as well confirm the strength of a trend and as well know when to break out of a trade .
The Alligator indicator consists of three lines which are:
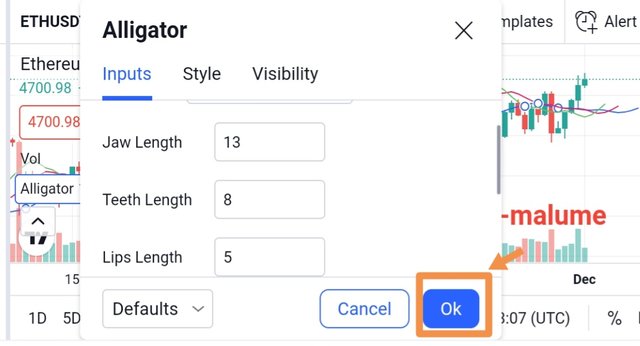
- The Green line is known as lips of the Alligator and is set to 5 and dislodged into the future by 3 periods .
The Red line is known to be the Alligator teeth and is set to 8 periods and is driven 5 periods into what's to come
The Blue line as well is known to be the jaws of the Alligator and is set to 13 periods and dislodged 8 periods into what's to come.
image analysis below
Uses:
The Alligator indicator can be used to detect the market trend at the period of time in a sense that , At the point when the market is ranging, the Alligator is at rest and as well at the point when the market gives indications of a pattern, the Alligator awakens and buyers/sellers can choose to make entry at the point.
Calculations on Alligator indicator
The jaw line is smoothed moving average of 13 periods ( candle) and smoothed by 8 periods( candle)
The Teeth Line is smoothed moving average of 8 periods( candle) and smoothed by 5 periods( candle)
The Lips Line is smoothed moving average of 5 periods ( candle), and smoothed by 3 periods( candle).
Mathematically
The Middle Price = (High + Low)/2
While the Alligator jaw = SMMA (Median value, 13, 8)
The Alligator teeth = SMMA (Median value, 8, 5)
The Alligator lips = SMMA (Median value, 5, 3)
Where:
Middle PRICE — middle price;
Furthermore, too
SMMA — Smoothed Moving Average
For instance, Lets have the SMMA (MEDIAN PRICE, 8, 5) which this implies that the smoothed moving avergae will be determined on the middle cost, smoothing period being equivalent to 8 bars and shift being 5.
Question2 - Show how to add the indicator to the chart, How to configure the Alligator indicator and is it advisable to change its default settings ? (Screenshot required)
I will be showing steps on how to add the alligator indicator on a chart ,from the website Tradingview
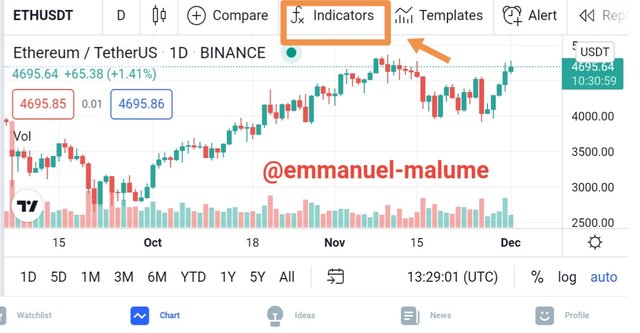
- Step1- After clicking on the cryptocurrency pair of your choice and its loaded on a chart as displayed below , click on the Fx indicator from the top bar as circled.
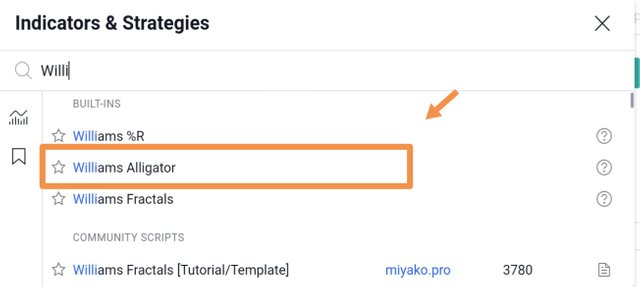
- Step2- Then in the search box , you search for the William Alligator , note that its same with alligator indicator just as we have discussed earlier, where i made mentioned that williams introduced the alligator indicator due to its study on the alligator animal.
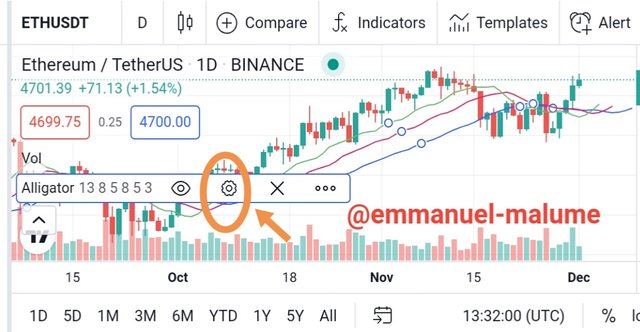
- Step3- Then the indicator is successful added on the chart, where we could see the three lines oscillating, which are red line(teeth), blue line(jaw), and green line(Lips)
From the indicator display settings, we could as well choose to configure the Alligator indicator due to our own preferences.
- Step1- From the indicator line we could click on the setting, which will take us to the configuration mode of inputs, styles and visibility
- Step2-. Then we can decide to edit the Alligator indicator input settings by making an adjustment with it, it's best leave the indicator input settings at default or at least make a fibonnaci retracement numbers with it.
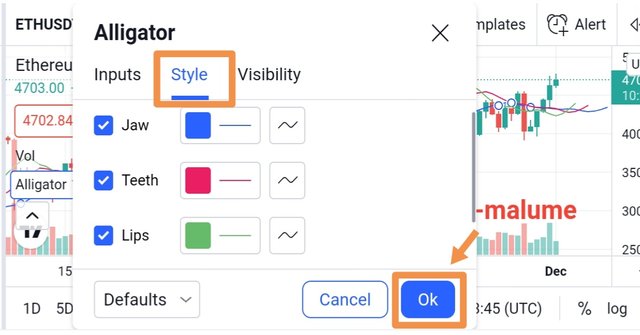
- Step3- And as well, we could decide to change the style settings , by adjusting the lines color, just as I mentioned earlier where the red line indicates the teeth, but in this case, we can choose to change the color from red to any color of our choice or better still, leave the indicator style as it is by default.
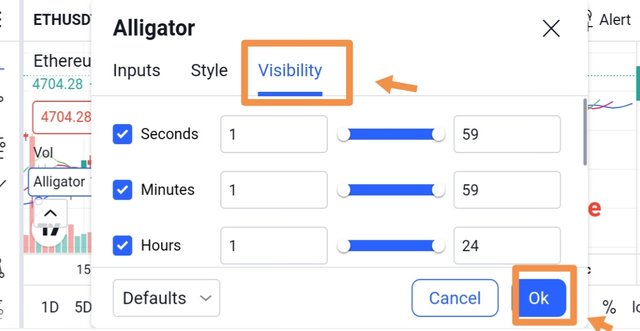
- Step4- The last which is on the Alligator indicator settings is the visibility settings, where we can choose the time period we want the indicator to be displayed on.
It's in my believe that when it comes to trading strategy, no advice is best advice and as well no advise is good advice, whatever happen making a trade is certainly at trader's risk level as it's of certainty there would be loss, the only way we can counter this situation is to minimize the loss level.
Traders often choose whatever position is best, or whatever they choose to have familiarize with, I believe same can be accustomed when using the Alligator indicator as I believe traders can choose whatever best styles or input or visibility settings work best for them.
And at the same time, when making use of Alligator indicator, the indicator settings at default is actually at the best position, because that's what actually made up of the alligator indicator, which I believe that any tampering with the settings mostly the input settings such as the fibonnaci numbers might tamper with the whole Indicator display and might properly not longer work at best to traders want.
So this comes to my responses, that No, it is not advisable to tamper with the Alligator indicator settings but rather leave the indicator at default.
Question 3 - How do we interpret this indicator from its 3 phases: the period of rest(or sleep), awakening, and the meal phase?(Screenshot required)
The Alligator indicator can be interpreted to three phases which are rest phases, awakening phases and as well the meal phases. I will be showing the phases with chart illustration below
Rest Phases:
We can as well used the alligator indicator to know the current situation which the maket is , such as at the point when the green, red and blue lines are extremely near one another or meshed, we can say the market is at rest or the market is at range , where we could only wait to see what the market will do next as the indicator is implying no direction when the alligator is at rest. image illustration below
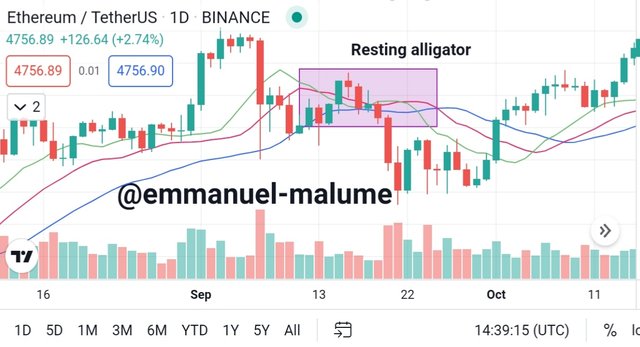
From the image above, we could see the Alligator been at rest as all the lines are intertwined and as well the correlation of the indicator with the market, as there is no trend been formed currently. This shows a Resting Alligator.
Awakening phases:
The alligator indicator is awakening at the point when the red and blue line are moving midpoints in a similar way, but the green line moves through them, and every one of the three wind up heading a similar way, proposes to traders that the trend is about to begin its new form.image illustration below
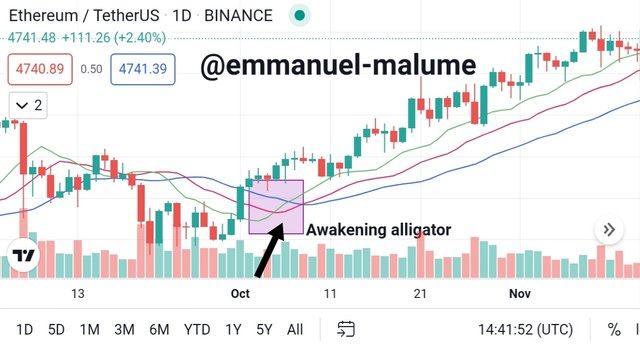
From the image above, we could see how the green line moves through the three lines to form an uptrend, at the point the green line moves through the two lines shows the Alligator is waking to pick a bullish trend from its rest.
Meal Phase:
The alligator meal phase occur at the point when the green line is over the red line and the red line as well is over the blue line, which thus indicate that, there is an uptrend, and when the request for the lines is switched when the blue is at the top, and the red line is at center, and the green is at base, then market is in a downtrend position. And as well, at the point when the lines extend, it affirms the strength of the trend.image illustration below
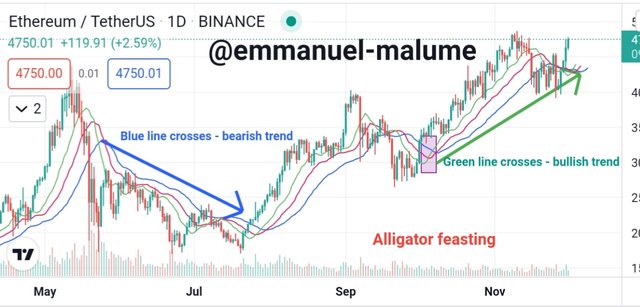
From the screenshot above, we could see clear illustration of a feasting Alligator, as we get to confirm both bullish and bearish trend on the chart. Just as explained earlier that the market is in bullish when the Alligator lips (green line) is moving above the two lines and as well the market is in bearish when the Alligator jaw (blue line) is moving above the other lines. Which thus bring clarity to our market trading as we get to see expansion in the lines.
Question 4 - Based on the layout of its three moving averages that make up the Alligator indicator, how can one predict whether the trend will be bullish or bearish (Screenshot required)
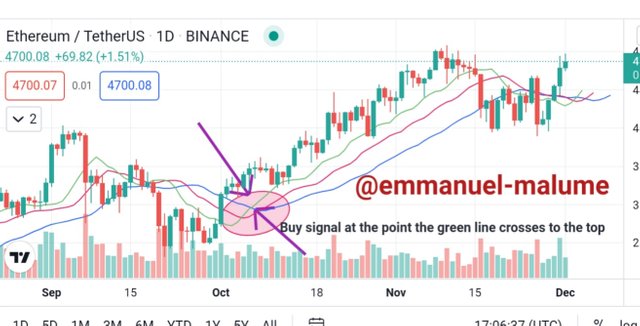
Bullish Prediction:
Based on the three lines on the indicator, we can use this to make prediction of the market direction and as well to know if a market is moving in a Bullish direction.
The bullish trend occurs when the alligator green line is moving above the red line, and as well the red line which is at the center is also moving ahead of the blue line which thus indicate that our market is moving in a bullish trend based on the alligator line analysis .
And as well , we could predict the market with the alligator as bullish when the market price is moving ahead of the indicator, which this is same as EMA indicator.i.e we could also make the same prediction with the alligator indicator.
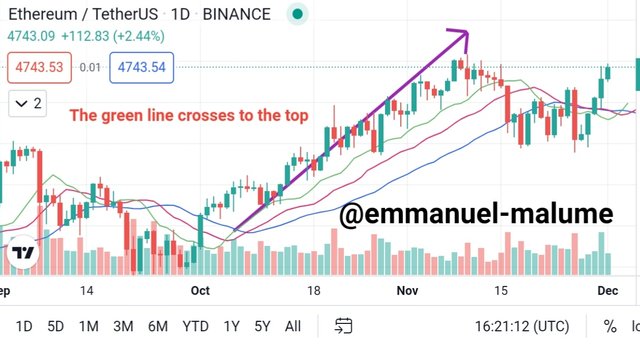
From the image above , we could detect the bullish signal as we saw the green line crosses to the top, leaving the blue line at the lowest level and as well the red line remain at the center.
Bearish Prediction:
Based on the three lines on the indicator, we can as well use this lines to make prediction of the market direction and as well to know if a market is moving in a Bearish direction.
The bearish trend occurs when the alligator blue line is moving above the red line, and as well the red line which is at the center is also moving ahead of the green line , which thus indicate that our market is moving in a beraish trend based on the alligator line analysis .
And as well we could predict the market with the alligator as bearish when the market price is moving below the indicator, which this is same as EMA indicator.
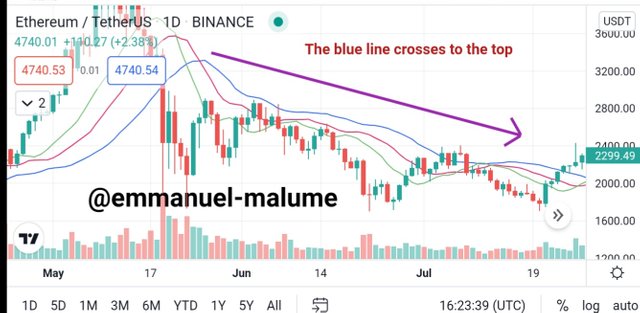
The alligator indicating to us the bearish trend, as we get to see the blue line moving at the top of the other lines and as well the green line been at the base level which thus leaves the red line at the center.
Question5 - Explain how the Alligator indicator is also used to understand sell / buy signals, by analyzing its different movements.(screenshot required)
The alligator indicator can as well be utilized to know when to make entry into the market . i.e we get to notice the buy and sell signal using the indicator. below is my analysis on buy/sell signal with the alligator indicator.
Buy Signal:
The Alligator Indicator technique signals Buy signal when sleeping Alligator awakens, all in all when market is acquiring a developining trend towards uptrend, however prior to entering the the market , traders should ensure these conditions are met;
The interlaced lines of the Alligator start to go up - then the alligator opens its mouth upwards.
The blue line of the Alligator indicator ought to cross beneath its red and green lines in a base up way showing a bullish pattern.
- And as well when the Oscillator begins to develop from range , with the green color leading the oscillator.so that particular point signals a buy entry into the market.image analysis below.
Its important to note that when making a buy entry with the alligator indicator, its best we let the green line moves above the lines in three candles at least, so as to make confirmation of the signal before we make our purchase.
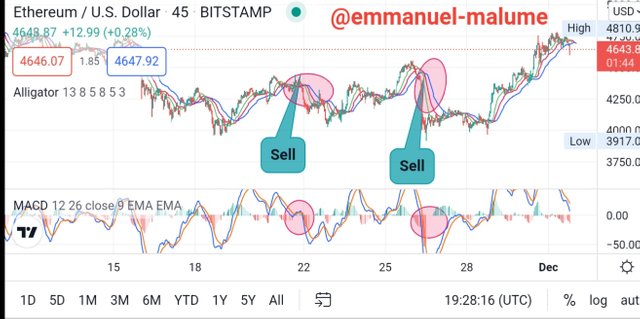
Sell Signal:
The Alligator Indicator technique signals sell signal , when market is acquiring a developining trend towards downtrend, however prior to entering the market for sells, traders should ensure these conditions are met;
- And as well, The interlaced lines of the Alligator indicator start to go down when the alligator opens its mouth downwards.
- The green line of the Alligator pointer ought to cross beneath its red and blue lines in a base down way showing a bearish structure.
- And as well when the Oscillator begins to develop from range , with the blue color leading the oscillator.so that particular point signals a sell entry into the market.image analysis below.
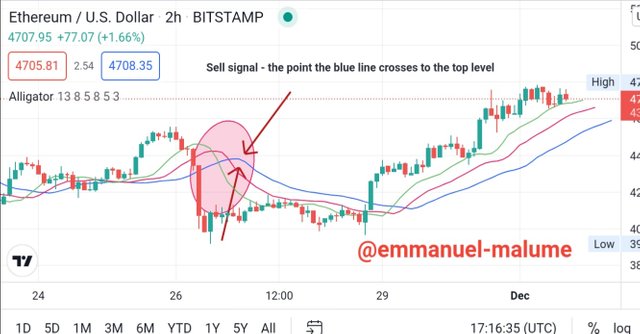
Its important to note that when making a sell entry with the alligator indicator, its best we let the blue line moves above the lines in three candles at least, so as to make confirmation of the signal before we make our sells.
Question 6: Do you see the effectiveness of using the Alligator indicator in scalping trading style? Explain this based on a clear example.(Screenshot required)
The Alligator indicator technique for scalping is an exceptionally straightforward pattern .
These method permits traders to detect the fundamental pattern, and thusly, scalping signs can be satisfactorily done on an assortment of time frames.
One huge benefit for utilizing this methodology is its capacity to oversee positions without wrapping into another trade.
The system limits the danger of sharp value changes during the trade .
We can then make trade base on the retracement from the previous trends, so as to give confirmation to our next trading decision.
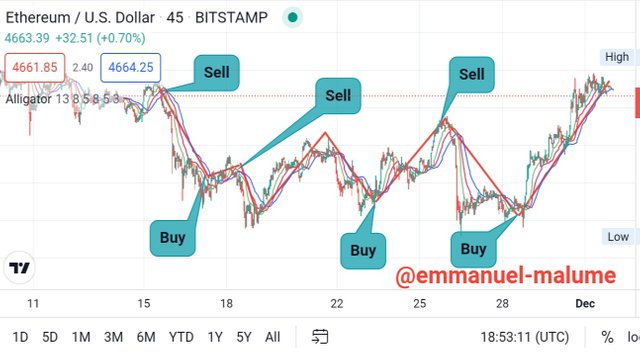
From the image , we could see some retracement of buy and sell signal from the previous trends, which we can then utilize this methodology to predicts the next market position. Where we get to notice from the chart that the buy and sell trend keeps getting longer than the previous retracement.
Question 7 - Is it necessary to add another indicator in order for the indicator to work better as a filter and help get rid of unnecessary and false signals? Use a graph to support your answer
Yes , it is necessary to pair the alligator indicator with other indicators so as to filter out false signals, thou false signals is likely uncommon with the alligator indicator simply because the indicator gives signal base on three moving Fibonacci exponentials which this proves it difficult to have three wrong calculations at a time.
Notwithstanding, its still advisable to pair all indicators with others , due to the fact that two or more indicators can never go wrong at a time.
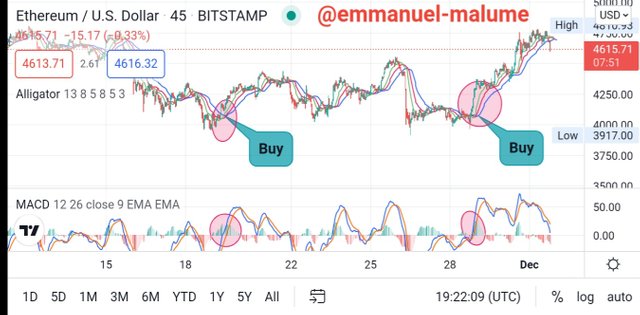
For this task, i will be pairing the MACD indicator with the Alligator indicator so as to show the correlation between the two indicators and as well there correspondence on a chart.
Pairing MACD indicator with the Alligator Indicator
Buy trade
Traders can use the combination of the indicators to Open a buy position when these conditions are met:
- The green line of the Alligator indicator ought to cross above its red and blue lines in a base up way demonstrating a bullish trend.
The MACD indicator ought to print sky-blue histograms over the zero-flat level showing a bullish pattern reversal.
The blue line of the MACD indicator ought to cross over the orange line showing a bullish pattern.
image shown below
Sell trade
Traders can use the combination of the indicators to Open a sell position when these following conditions are met:
- The blue line of the Alligator indicator ought to cross above its red and green lines in a base up way demonstrating a bearish trend.
The MACD indicator ought to print fire brick below the zero-flat level showing a bearish pattern reversal.
The orange line of the MACD indicator ought to cross over the blue line showing a bearish pattern.
image shown below
Question 8: List the advantages and disadvantages of the Alligator indicator
Below are the benefits the alligator indicator offer to traders.
The alligator indicator effectively incorporates with other indicators.
It is not difficult to recognize areas of divergencies or inversions with the indicator.
The alligator indicator calculation are aleady compurated meaning , You don't have to do the computations yourself.
The indicator is gotten from the moving average, which is one of the most amazing utilized indicators in the market and hardly gives false signals.
Moving average indicators sometimes are known to give false signals, thats why they cant be used as a stand alone indicator when making a trade.
The alligator indicator is fragile, and must not be tampered with as any adjustment in the indicator settings can lead to misbehave and can not be retraced unless been reset to default.
The Alligator indicator is a decent device for recognizing trends break out early and evaluating trend strength. however you shouldn't fail to remember that no indicator can give 100% precise signals which why it is best advisable to pair with others as well.
The Alligator indicator is considered sleeping when the three lines are getting over one another and the market is range-bound. At the point when the green line gets over the red line, it's an indication of a pattern getting dynamic sooner rather than later - Awakeing phases.
Traders should Note that the alligator indicator is smarter to use with different indicators so as to get more exact signs
Thank you all for following through
special regards professor @kouba01
@koubal01 is there hope for this to be voted.its been two weeks already
@steemcurator01
Hi, @emmanuel-malume,
Thank you for your contribution to the Steem ecosystem.
Please consider voting for our witness, setting us as a proxy,
or delegate to @ecosynthesizer to earn 100% of the curation rewards!
3000SP | 4000SP | 5000SP | 10000SP | 100000SP