Steemit Crypto Academy | Season 3: Week 7 || How to create an account on TradingView, how to use indicators,tools, features of tradingview
Source: pixabay.com Modified by @emimoron
Source: pixabay.com Modified by @emimoron
This is an Online Stock Exchange charting platform that enjoys great acceptance worldwide, it was created in 2012 by experts in the Multicharts charting market. It has a solid base in communities of traders around the world, its main service is constituted in the proportion of graphics that show the prices of cryptoassets at international level in the different exchanges and markets. It also facilitates technical analysis and has a service of interaction between users where different traders can expose their trading ideas and share useful information about the analysis and projections of the assets.
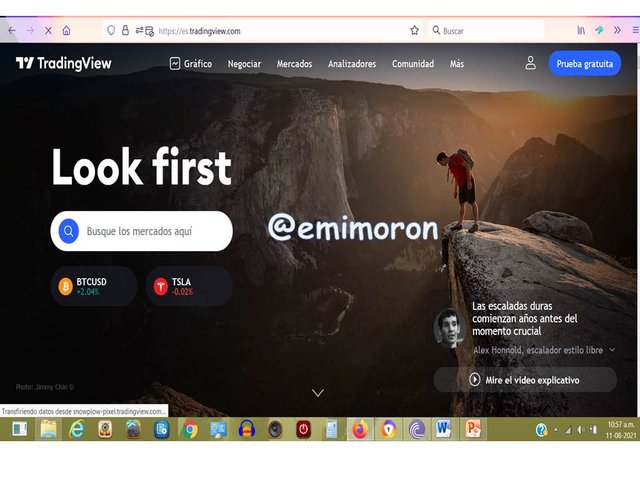
This arose as an initiative for traders to have a meeting place and not only to show the graphics but also to generate interaction of all those who perform this work. In this year 2021 TradingView is positioned as one of the most important trading platforms having in its system more than 29 million charts, 12 million investors, 5 million ideas published by users; its scheme of use is based on three fundamental aspects: Create, collaborate, share and learn.
Source: pixabay.com Modified by@emimoron
To create an account in tradingView the first thing to do is to enter the platform page, I did it from the platform for Latin America as my browser automatically directed me to it:
Step 1.- Enter the platform
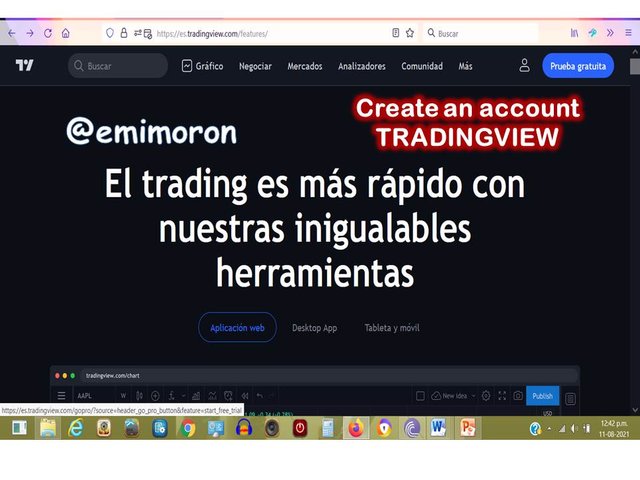
Step 2.- Select in the upper right corner where a figure representing a person appears, there a menu of options is displayed and we click where it says login.
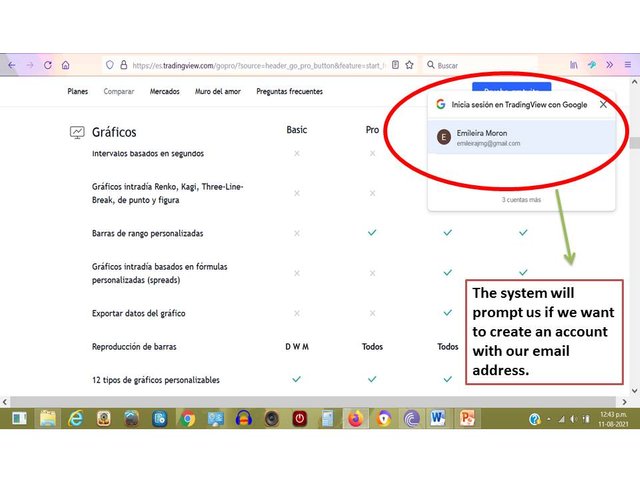
Step 3.- The system will direct us to the email address we want to use, this was in my case, because in my personal computer I always have my active accounts, so it immediately asked me which of my accounts I was going to use.
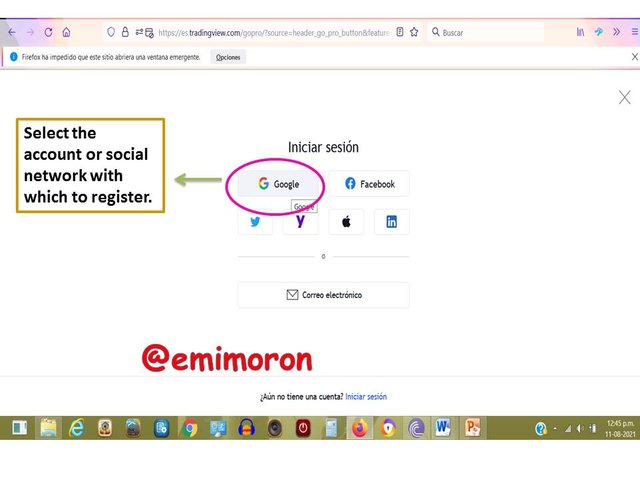
Step 4.- Select the email account that will be affiliated to the platform, in this step also if you want to do it you can place a picture to be in your profile.
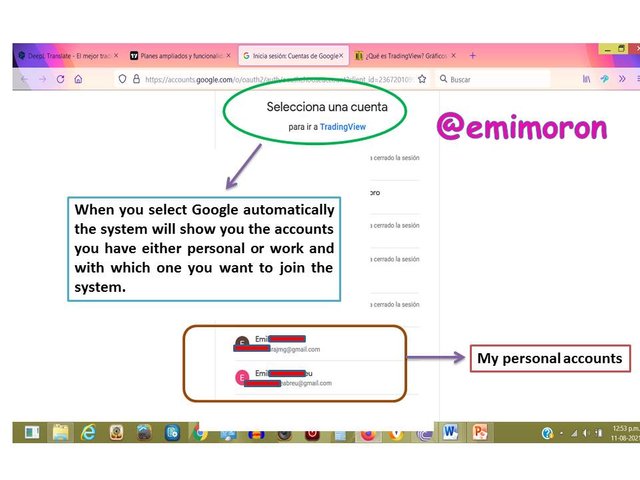
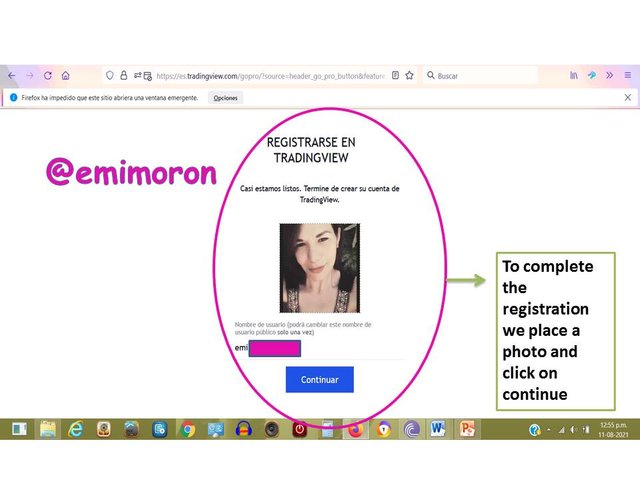
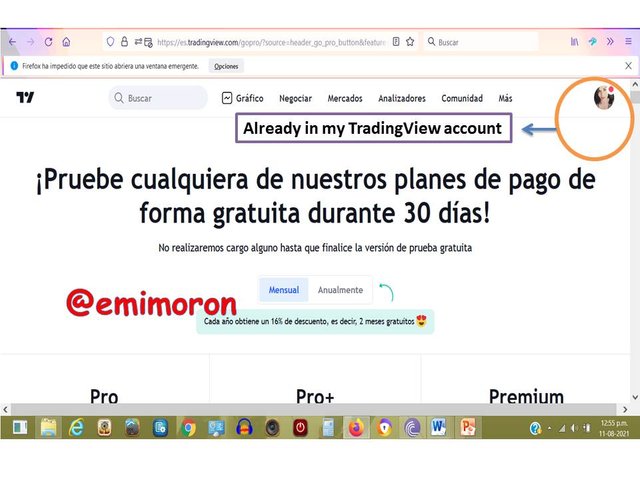
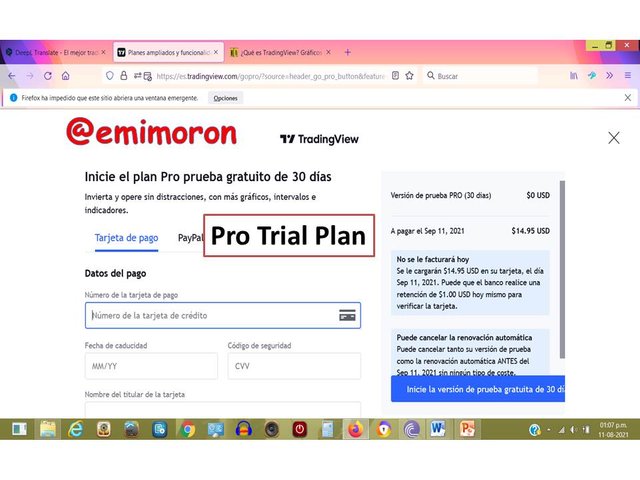
Once we have selected our account and attached our photo we click on the tab "Continue" to start enjoying the platform there will tell you that you have 30 days free trial and after that you can select the package that best suits your needs, they also point out that you can select it once and have some offers on the market. In my case I will test the 30 days with the PRO plan and then I will select a plan that suits me and that is easy to handle.
Source: pixabay.com Modified by @emimoron
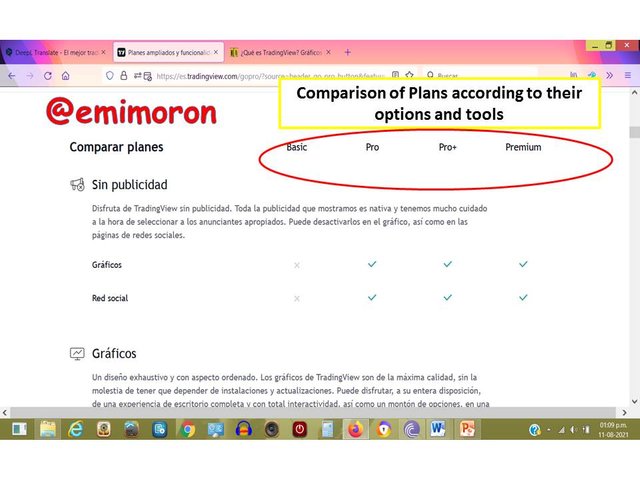
Among the plans offered by the platform are:
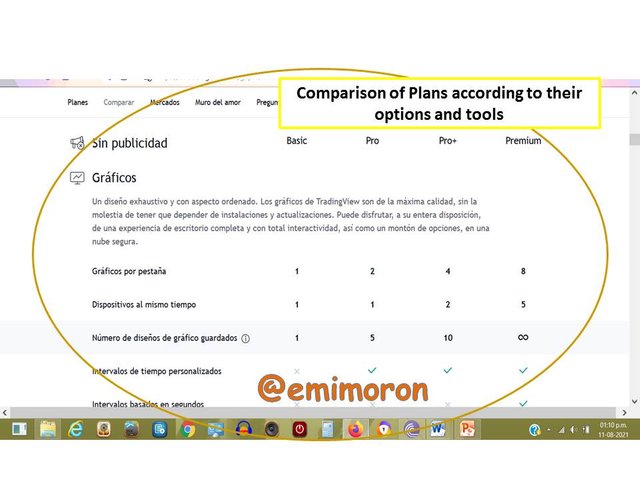
Basic Plan: this is a rather limited plan in terms of user support functions, chart viewing capabilities and tools. It also has a problem which is advertising because in this plan you can open pop-up windows with advertising. It does not allow the use of the traders' chat or access to trading ideas. Even when the charts can be displayed, it only accepts a modified chart to be saved. As for the financial history, it shows an annual history for 7 years and a quarterly history for 8 years. As you can see it is a plan for those who do not have much experience in trading or are just discovering what this market is all about.
PRO Plan: Offers basic services a little more extensive and is ideal for those who are starting in the world of trading, its limitations are in having fewer indicators and graphs, in this case offers the option of 5 indicators per chart, two graphs per window, reproduction of bars in intraday bars. This plan is free of advertising and allows interaction but not the creation of personalized chat, through this option you can view the ideas of other users and publish your own.
PRO+ Plan: It is a superior plan to the first two, this one can even be used on two devices at the same time, you can export data, it shows 10 indicators per chart and 4 charts in the same design. It also has the option of exporting data with customized formulas. It also has an infinite indicator template for users, in this alerts are generated through webhook. It has a capacity of 10K of historical data bar. Assistance in priority mode to the user.
Premium Plan: It is the most complete and all the options described above are enhanced and some such as the display of graphs, number of saved designs, alerts responses through webhook and data time is infinite. The Premium plan is recommended for those who are dedicated to trading as a way of life and economic activity.
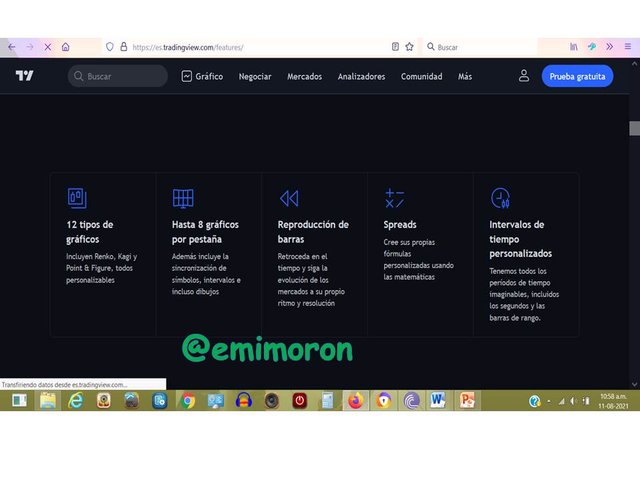
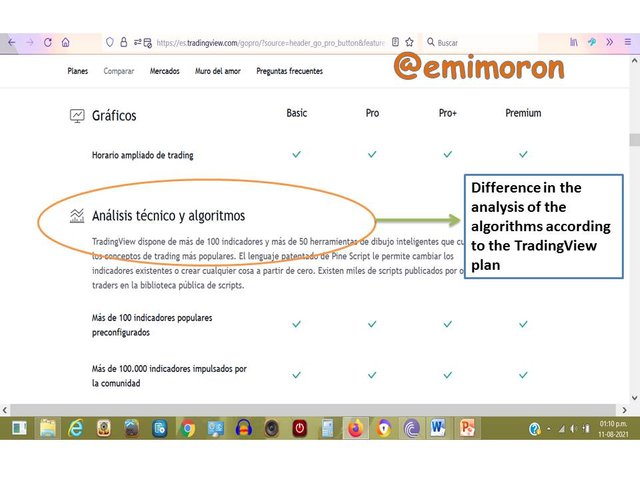
Below are some screenshots of the benefits of each of the plans:
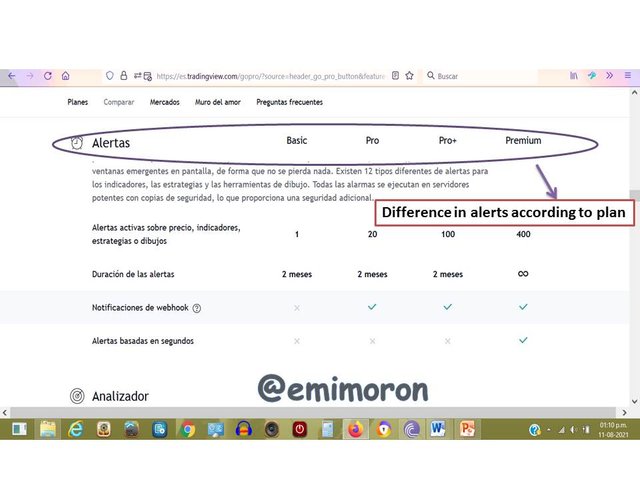
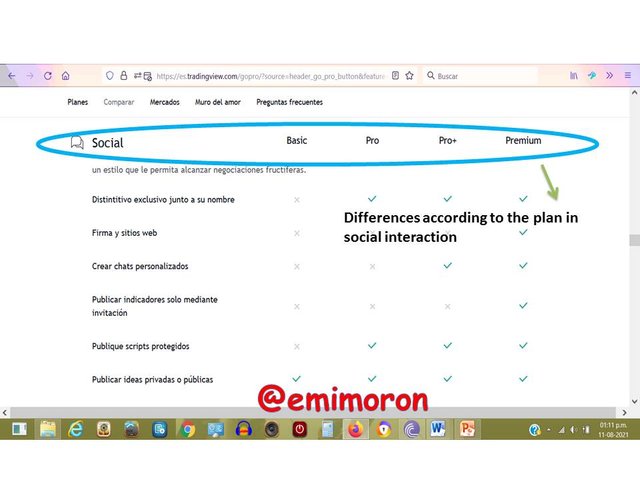
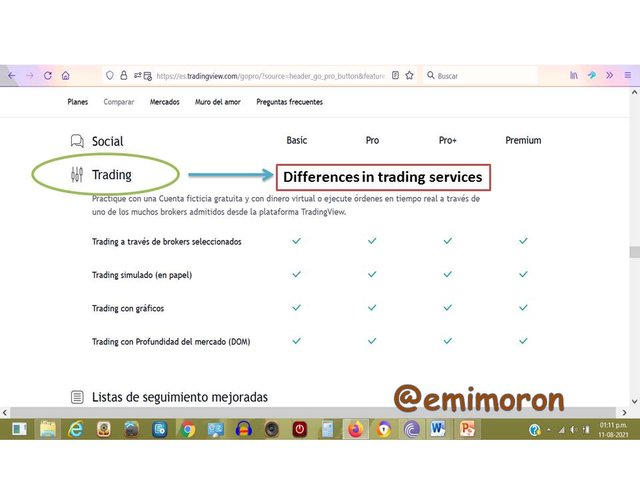
Source: pixabay.com Modified by @emimorn
The trading activity is transmitted live showing its results in videos that are in the same platform. It also has a chat between users worldwide and a database of ideas of the main traders allowing it to function as a social network as well as a financial one.
The language used by the platform is the Pine Script better known as programming language of traders, which corresponds to a language based on lines of code through which users can publish their ideas about trading this is structured in the cloud and uses the resources of this to build the communication codes hence it differs from other computer languages.
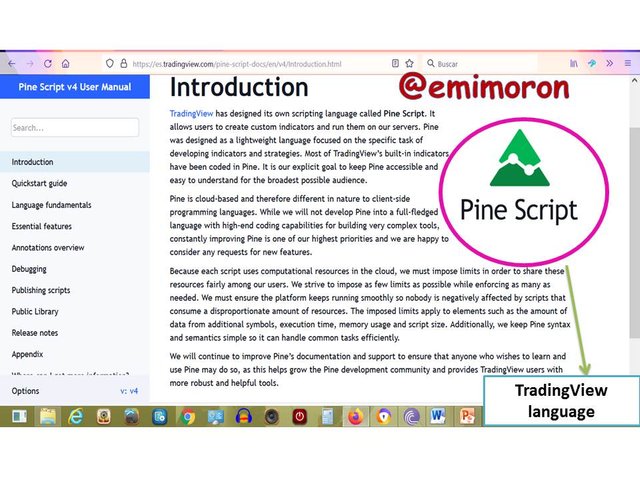
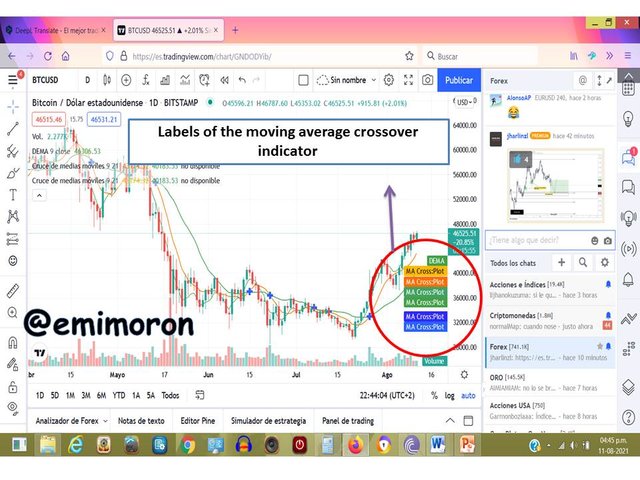
The platform has intelligent drawing tools and other chart and market analysis strategies that cover the most used trading concepts, such as candlestick patterns, multiple period analysis, correlation, moving average crossover and many more.
This platform, among its many advantages for people in Latin America is also shown as one of the main and most used because it works very well and in Spanish language. In this sense, the main website is tradingview.com but for the Latin American market you have es.tradingview.com. The difference is only in the language because the functions on both pages are exactly the same, only if you are going to publish something you must do it according to the language of the website where you are.

The payment methods on the platform for the use of accounts and Premium programs is through Paypal as well as in cryptocurrencies through Coinbase. To buy real time data or intraday data you have to buy them in additional packages.
Its operation is simple only you must have a computer with internet access, it is not necessary to download this platform on the computer this works online and with a capacity to replicate all the graphics and functions without the need for it to be configured as an application on your computer. In this case you can review the charts for a few minutes without the need to register. Afterwards the platform will ask you to register, which is easy to do.
Source: pixabay.com Modified by @emimoron
Source: pixabay.com Modified by @emimoron
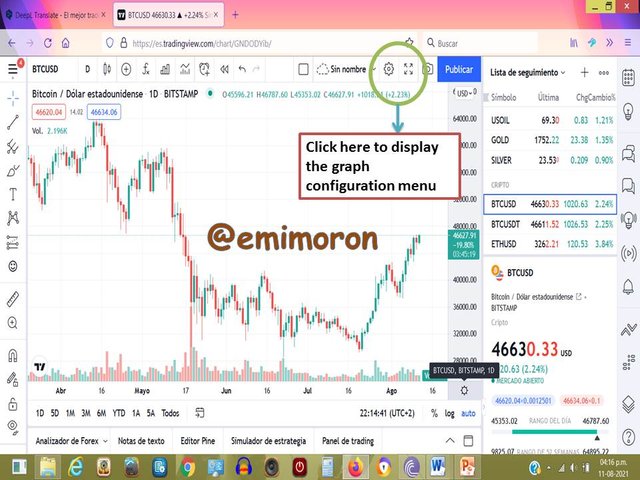
The first thing we do is to enter our account in the option of the top band where we will locate the charts tab.

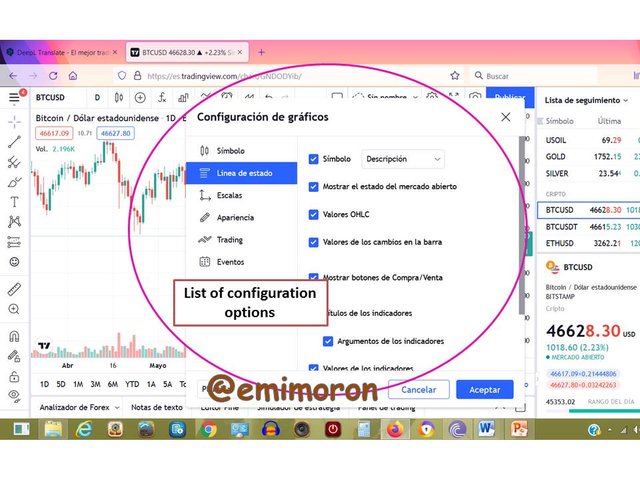
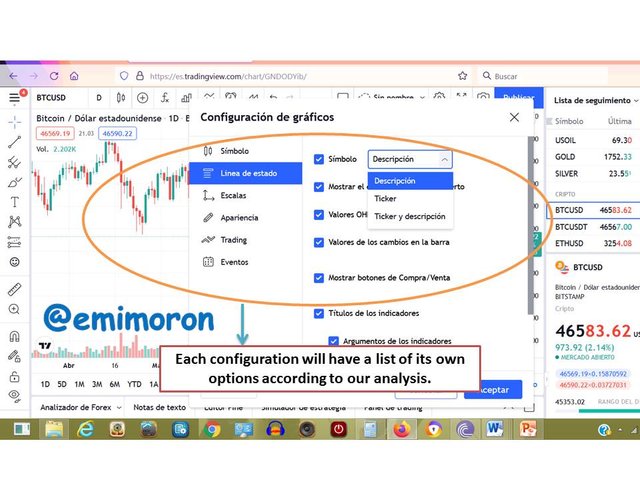
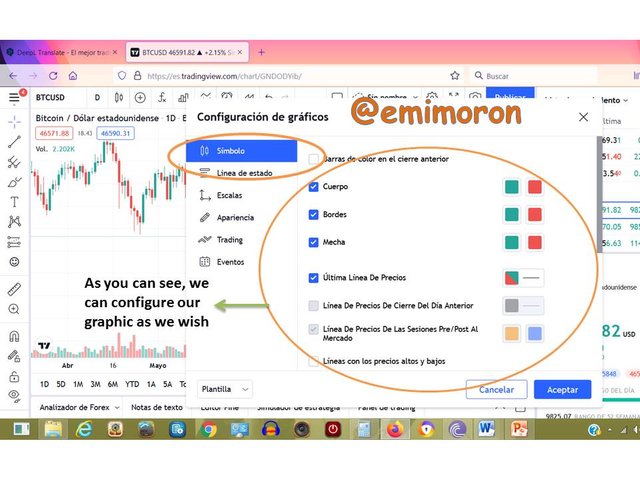
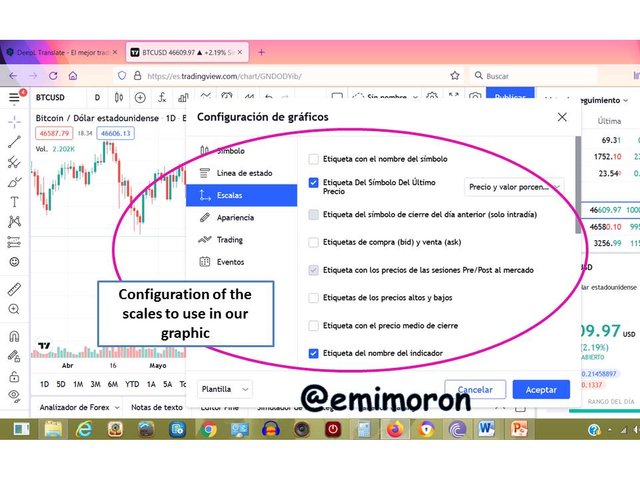
After that a menu with the different options for our configuration is displayed, when we add a configuration to our chart we must click "Accept" the changes that we will later visualize in the chart. Below is a sample of each of the chart configuration options in TradingView:
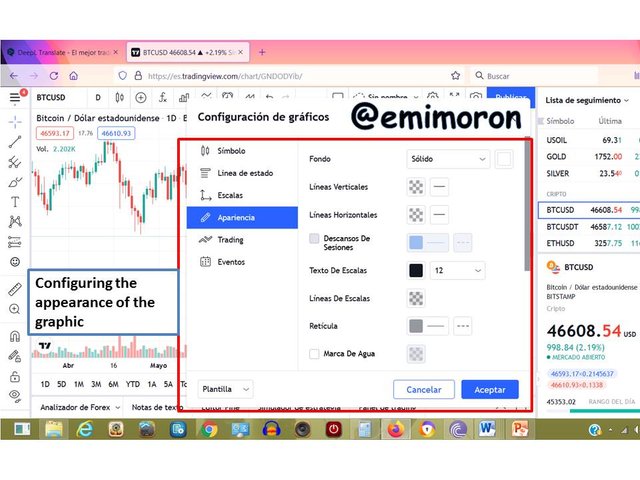
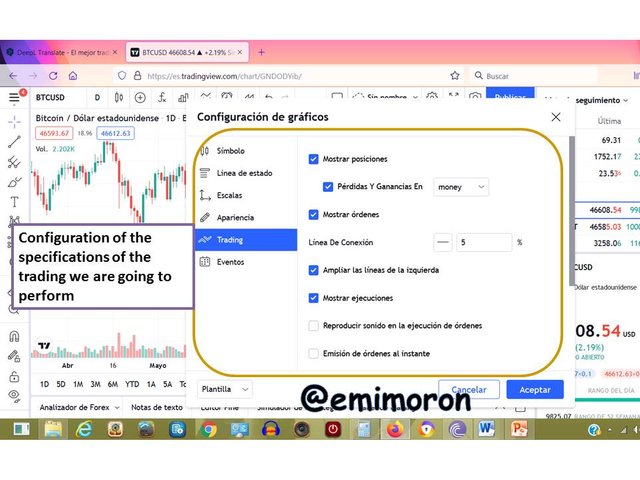
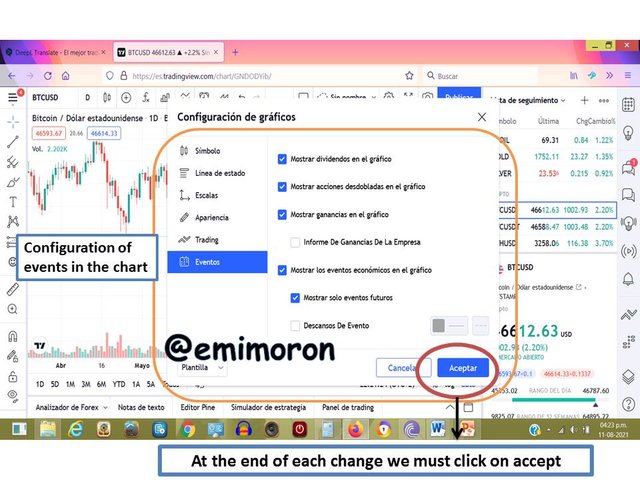
Source: pixabay.com Modified by @emimoron
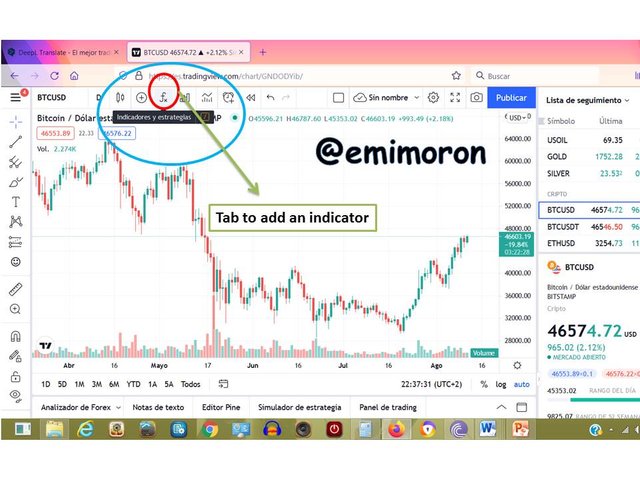
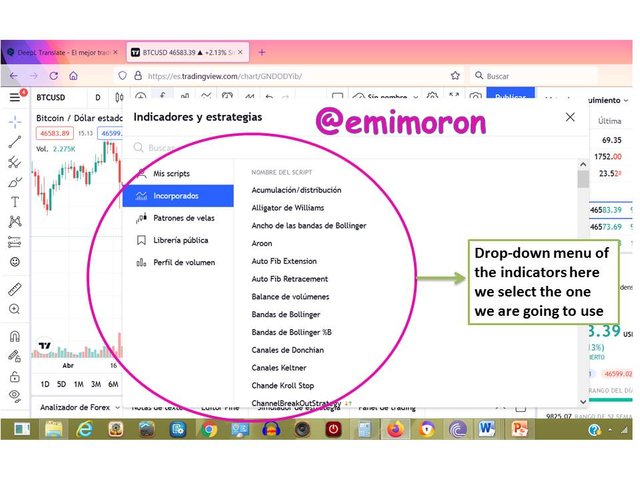

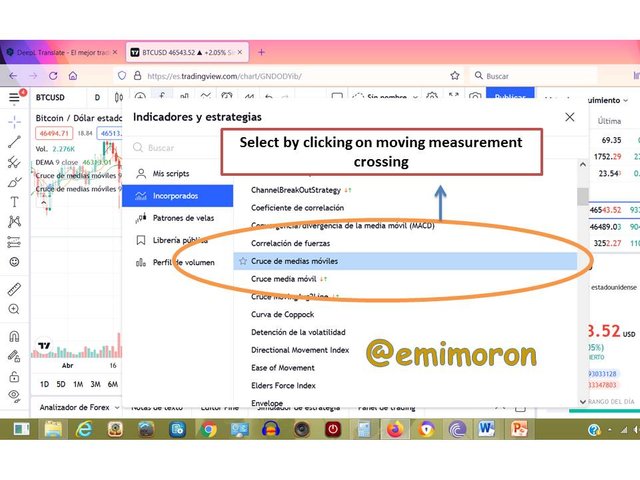
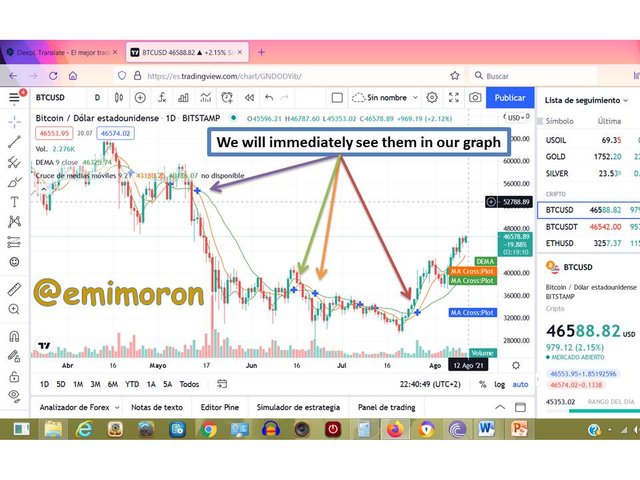

Source:pixabay.com

Source: pixabay.com
In this opportunity we have reviewed in depth the TradingView platform which presents a wide variety of charts and tools for analysis, it is a friendly and easy to use platform. TradingView is a platform designed for those who want to trade formally or are starting in it.

Among its plan options and promotions is a basic plan that can be purchased at no cost and from there three more plans that you can try with 30 days free trial, TradingView allows you to configure the graphics and save them to make statistical analysis and projection in cryptoassets.

Thanks to all who read and support us every week on the @steemitcrytoacademy especially the teachers this week @yousafharoonkhan also @steemcurator1 @steemcurator2 @steemitblog
Hi @emimoron
Thanks for participating in the Steemit Crypto Academy
Feedback
This is very good work. Well done with your research study on the Tradingview platform.