Crypto Academy / Season 4 / Week 1 | Homework Post for professor @sapwood | Onchain Metrics
We are back for another season of learning with the #CryptoAcademy, and this time I am going to share with you my research regarding the topic exposed by Professor @sapwood about Onchain Metrics and how they can help us in the elaboration of a fundamental analysis. Let's get started!
Own design elaborated in PowerPoint.

(1) What is a HODL wave, how do you calculate the age of a coin(BTC, LTC) in a UTXO accounting structure? How do you interpret a HODL wave in Bull cycles?
A HODL wave is a graphical representation that, through a color scheme, shows us the movement of a cryptocurrency in a certain period of time, by reviewing onchain data, specifically HODL data, providing a perspective of the coins accumulated in the respective wallets through the UTXO accounting model, i.e. we can study the age of the coins that are mobilizing, creating a distinctive pattern in the graph.
By making use of bands of different colors we are shown the fraction of a given cryptoasset that has been last moved for a selected time period. Basically we are shown two color settings:
- Warm colors: such as red, orange and yellow representing recently traded cryptoasset.
- Cool colors: from light yellow, green to blue, with these colors we are shown assets that have not been traded during a certain period of time.
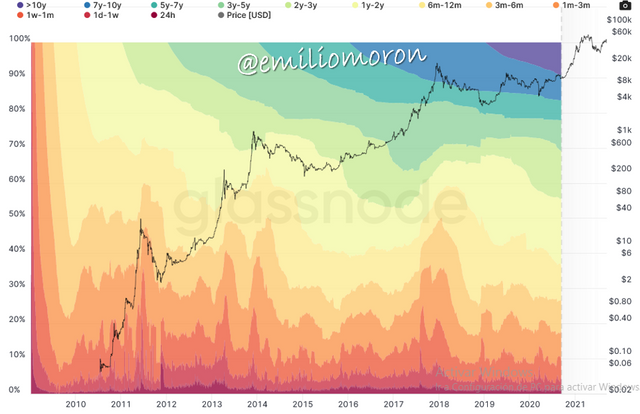
HODL wave for the BTC. Source: Glassnode.
The relationship between these two groups of colors can be used to analyze investor behavior over a market cycle. And as time goes by, the bands become larger and larger, which generates in the graph the scheme known as HODL wave.
Calculation of the age of coins with the HODL wave
To determine the age of a coin we are going to make use of the color scheme of the bands on the chart, the color bands work as age bands, and according to the color settings they range from 24 hours (red), between 1 day and 1 week (dark orange), from 1 to 3 months (light orange), between 6 and 12 months (yellow) and between 1 or more years (colors from light yellow to blue, or 10 years in the case of Bitcoin. In the following image we can summarize all the age bands.

Color scheme according to the age of the coins. Source: image created in PowerPoint.
For example, in the following HODL wave chart for Bitcoin we can see that by early 2010, when only BTC was a year old since its emergence, 57% of the existing BTC was contained in the 6-12 month age band, and from this point on we see that a large light yellow band starts to appear, which means that there is a large percentage of holders who have not moved their BTC in more than a year, then we see that the light green band appears, because the holders with more than one year now become holders with more than two years without moving their coins. And the same applies for the following age bands, showing us that by September 2020 (the latest period recorded) about 10% of the existing BTC has not been moved for 10 years, with the largest percentage concentrated in the 6-12 months age band.
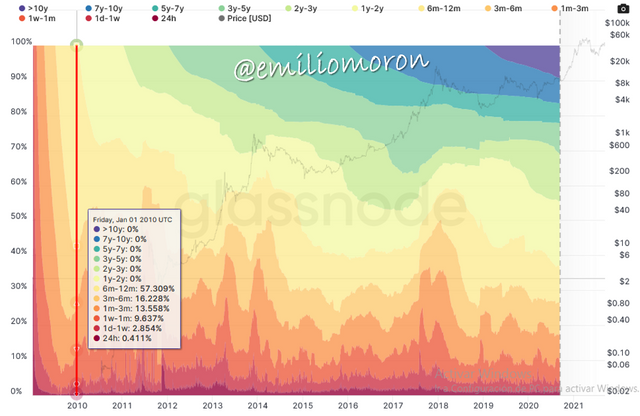
HODL wave for the BTC. Source: Glassnode.
Interpreting a HODL wave in bullish cycles
In the HODL wave chart we can see that when a new band is formed the previous one is reduced, indicating the passage of holders from one period to the next, but when there is a peak in the currency movement this also occurs, so we can see what type of holders are responsible for the sell-off.
Thus, the HODL wave links spent coins to unspent coins in a market cycle from UTXO transactions. Thus, if a band instead of shrinking expands, it refers to an increase in the percentage of holders who do not move their coins, keeping their funds intact for longer. Then, the little change in the UTXO means a lower availability of the currency in the market, which influences the increase of the price giving rise to a bullish cycle.
For example, if we look at the following chart for BTC, we notice that before the July 2017 high, the 3-5 year band was the widest, meaning that BTC owners between 2 and 3 years held their positions quite a bit and moved to the older band. Then we see that between the July 2017 and January 2018 highs these 2-3 year and 3-5 year bands narrowed quite a bit, meaning that a large percentage of BTC holders between 2-5 years took their profits at the end of 2017.
<
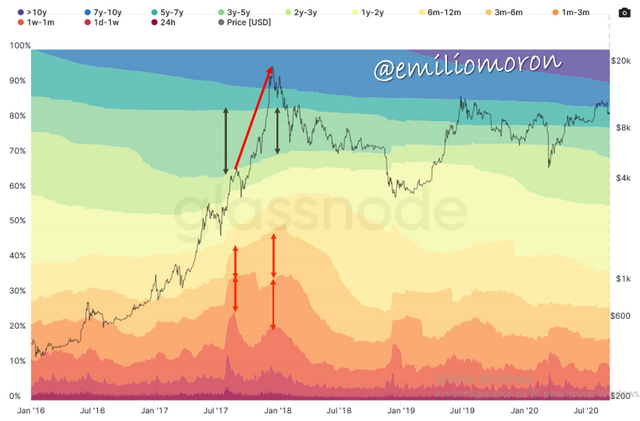
Comparison of age bands. Source: Edited image, original from glassnode.
We can also observe that in the highs reached in January 2018, the orange bands are wider with respect to the high of July 2017, with which we can determine that during this period, there were fewer short-term transactions, so that the unmoved currencies in the wallets were able to mature to ages 3-6 months, which favored the trend of the moment.
(2) Consider the on-chain metrics-- Daily Active Addresses, Transaction Volume, NVT, Exchange Flow Balance & Supply on Exchanges as a percentage of Total Supply, etc, from any reliable source(Santiment, Coinmetrics, etc), and create a fundamental analysis model for any crypto[create a model for both short-term(up to 3 months) & long-term(more than a year) & compare] and determine the price trend (or correlate the data with the price trend)w.r.t. the on-chain metrics? Examples/Analysis/Screenshot?
To perform the fundamental analysis requested in this question I have chosen to work with Ethereum.
Daily Active Addresses
When performing fundamental analysis many look at the number of daily active addresses on a given network, this is done to get a view of how much that network is being used. That is, more new active addresses correspond to a greater number of users who are adopting that network or are acquiring its tokens. While not used as a stand-alone indicator, it can provide valuable information for a valuation of a coin.
Let's look at the analysis of the number of active addresses for Ethereum.
Short term
In the following graph we can observe the behavior of this network between the months of June and September.
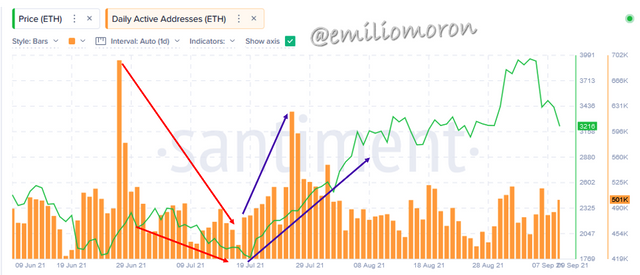
Source: Santiment.net.
We can observe that during the first 20 days of June the downward trend of the price coincides with the decrease in the number of active addresses, but an increase of these that began on June 22 and continued until registering a maximum of 683021 active addresses on the 28th anticipated an increase in the price of ETH, going from $1874,669 (06/22) to $2078,12 (06/28).
After the maximum reached by the number of active addresses began a new downward trend of these, which can be correlated with the downward trend of prices, however on July 19 we can see a new increase in the number of active addresses that coincides with the upward trend of the market, we can see that on July 27 reached a maximum of 622702 active addresses, which placed the price at $2292.78 and kept on rising until it was above $3000 despite the decrease in the daily address activity, however we can observe that in August the number of addresses has remained between the range 450000 and 500000, so we can correlate this behavior with the support of the price around $3200.
Long term
In the following graph we can see how the price of Ethereum correlates with the number of active addresses over a period of one year.
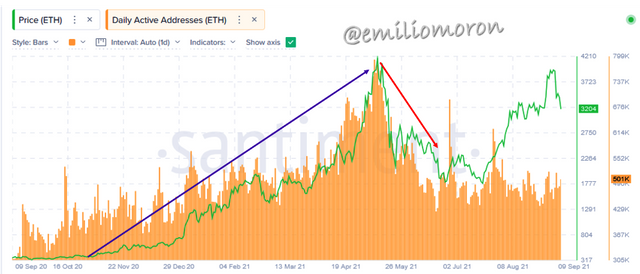
Source: Santiment.net.
In this graph we can see how during the period from September 2020 to May 2021, the number of active addresses increased progressively, which fits very well with the general upward price trend, as we can see, the number of active addresses peaked at 794922 in May 2021, which coincided with the price peak of $3954. Similarly, the decrease we observe later in the number of active addresses is consistent with the downtrend in prices, which led the price to settle below $2000 in mid-June 2021.
In general we can say that the number of active addresses can be very well linked to the price trend of the currency, in the short or long term, which allows us to make an assessment of this very important for the fundamental analysis of it.
Transaction Volume
The transaction volume refers to the trading volume of a currency in the market, it can be a very important element to consider as it gives us an insight into the sentiment of investors for that currency, buying or selling more or less actively. The transaction volume serves as a tool to anticipate possible fluctuations of the currency we are trading.
Let's see how it can be applied in the analysis of Etherum.
Short term
In the following graph we can see the trading volume for ETH in the last three months.
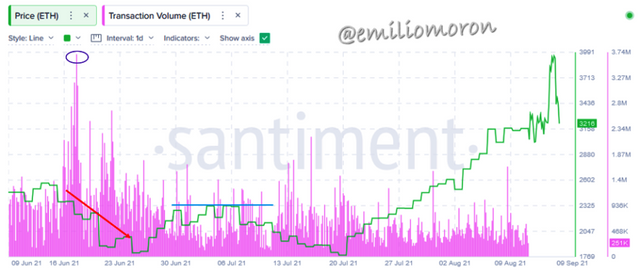
Source: Santiment.net.
In the chart we can see that on June 17th a maximum in trading volume was reached, reaching 3.7 million transactions, which started a downward trend in prices and also a decrease in volume. So it could be said that this sudden peak was a move by investors to exit their positions, which caused the price to fall, and the high volume during this downtrend only prolonged the price fall to $1800.
We can notice that after a recovery of the price at the beginning of July with a relatively low volume I create a resistance zone around $2300, but a new increase in volume made the price fall until July 20, from where we see the beginning of an uptrend but with low volume of transactions, so it could slow down soon.
Long term
The following graph shows the behavior of transaction volume for a one-year period.
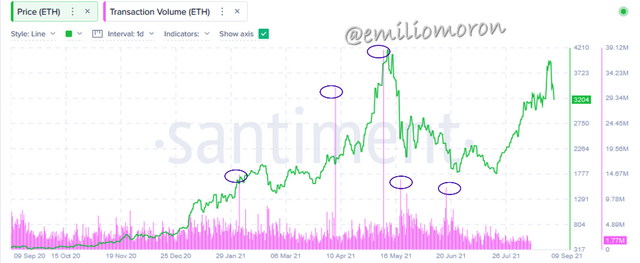
Source: Santiment.net.
In this case it is more difficult to observe a correlation between the volume and the price of ETH, we can notice that some highs in the volume coincide with highs and lows in the up and down trends, so we could still say that these highs in the volume metric are accompanied by a fluctuation in the price.
In general we can say that the volume metric is easier to correlate with the price in short periods of time, being difficult to interpret in long periods, so we must use other indicators to make a more accurate analysis.
Network Value to Transaction Ratio (NVT)
The NVT is an indicator with which we try to determine according to the value of the transactions the value of a network, let's say we are evaluating a currency that has a market capitalization of $1,000,000 and has a daily transaction volume of $20,000, then we say it has a NVT of 50. 000, then we say that it has an NVT of 50, but another coin with the same market capitalization has a daily transaction volume of $100,000, then its NVT will be 10. If we compare both coins, although they have the same market capitalization, we can say that the coin with NVT of 50 is overvalued with respect to the other one.
To analyze this value on chain metrics for Ethereum let's look at the following examples.
Short term
In the following chart we can observe the NVT ratio of ETH for the last three months.
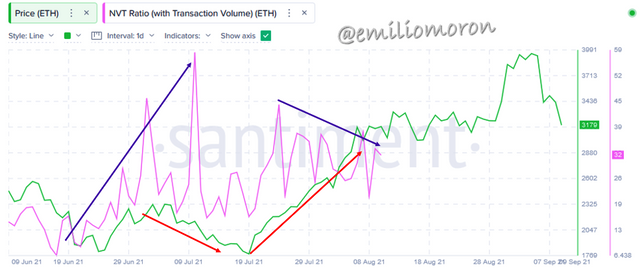
Source: Santiment.net.
As we can see we can relate an overvalued state of the network with a fall in prices, in the image we can notice that when the value of the NVT begins to increase the price initially tends to rise, but when it reaches its maximum levels the price begins to fall. And when the NVT has a low value again, that is, when the currency is undervalued, the price starts to rise.
Long term
In the following image we can observe the behavior of the NVT value for a period of one year.
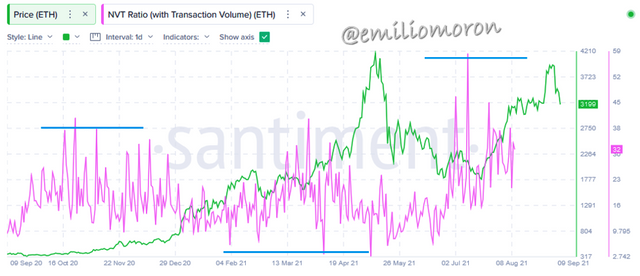
Source: Santiment.net.
In the long-term metrics for NVT value we can notice that there are certain levels of overvaluation and undervaluation that can correlate with price declines and rises respectively. Although it may be a little more difficult to establish this relationship in some periods of the chart, so we must combine this chain metric with other indicators to establish trends in long-term periods.
Exchange Flow Balance
We can consider the flow of assets from and to exchanges as an indicator of the market sentiment of a given currency, i.e., when there are strong movements from users' wallets to exchanges one could anticipate a downtrend in prices as the supply of the asset is increasing; while if users move their assets from exchanges to their external wallets, this could anticipate an uptrend due to a lack of supply.
Let's see how to apply this metric concept to Ethereum.
Short term
In the following chart we can observe the exchange flow balance for ETH in the last three months.
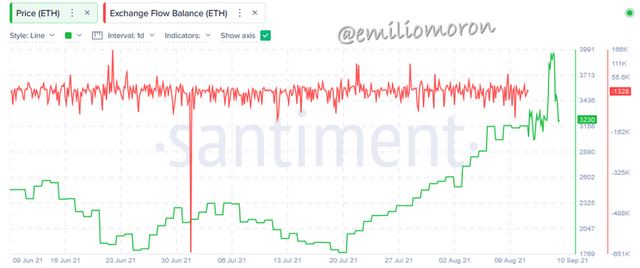
Source: Santiment.net.
In the graph it is difficult to observe a correlation between this metric and the price of ETH, in a general way we can observe that it moves within a range of positive and negative values; after the most distinctive peak in the graph produced on July 01 with a value of -645000 ETH, we can observe that there is a fall in prices, however in the subsequent upward movement we do not see any important signal in the graph of the exchange flow balance.
Long term
In the following image we can analyze the behavior of this metric over a period of one year.
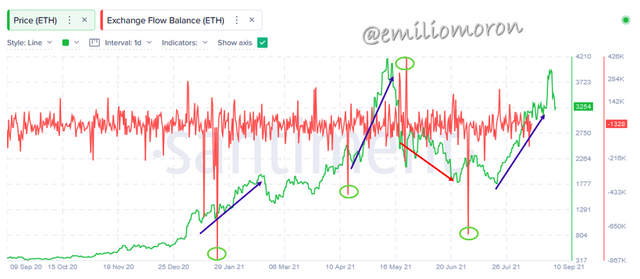
Source: Santiment.net.
In the graph of this metric for a longer period it is easier to observe that after the most negative peaks there is an upward trend in the price, similarly, when we observe a peak in the positive values, such as those formed between May 18 and May 23, 2021, there is a fall in prices.
So we can say that it is easier to establish a correlation between the Exchange Flow Balance and the price of the currency when evaluating longer periods of time than to make a short term analysis.
Supply on Exchanges as a percentage of Total Supply
This percentage gives us insight into the inflow of coins that are stored in wallets on exchanges; thus it can provide us with information about the supply of coins on exchanges.
Let's see how it applies to Ethereum analysis.
Short term
In the following graph we can observe the correlation between the Bid in Exchanges and the price of ETH for the last three months.
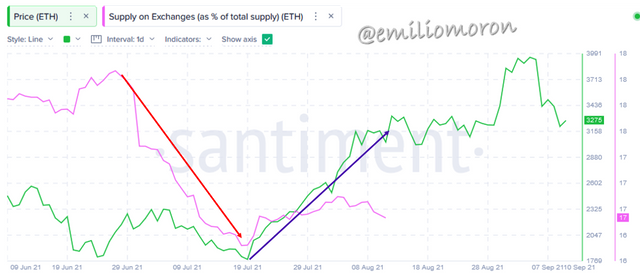
Source: Santiment.net.
In the graph we can see that the percentage of supply in exchanges starts a progressive decrease from 18.7% on June 27th to 16.8% on July 19th, after this movement we see the beginning of an uptrend in ETH prices.
Long term
In the following graph we can observe the correlation between the percentage of supply in exchanges and the price of ETH for a period of one year.
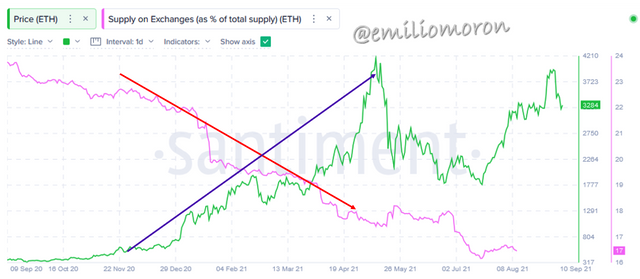
Source: Santiment.net.
In this case we can observe a clearer correlation between both variables, we can notice in the graph that as the percentage of the exchange offer decreases the price of ETH increases, as we can observe in the last year this percentage has decreased steadily from 24% to 17%, while the price has been increasing from $380 to $3279, so we can see an inverse proportionality between the trend of both values.
(3) Are the on-chain metrics that you have chosen helpful for short-term or medium-term or long term(or all)? Are they explicit w.r.t price action? What are its limitations? Examples/Screenshot?
According to the examples shown, I consider that the metrics in the chain are more useful for long-term analysis. Some indicators of these metrics such as Transaction Volume, NVT and the Exchange Flow Balance offer signals that are difficult to interpret in short periods of time (months), but offer very clear correlations with the price of the currency in longer periods (years).
If we need an analysis for the short term, it is advisable not to use these metrics independently, since we could find ourselves with unclear signals due to market fluctuations.
Price action
We know that the price of a given coin is determined by the supply and demand for it, but as we have been able to observe, although the metrics obey data provided to us by the blockchain, we can establish correlations between these metrics and the price of coins, since these metrics offer information that gives us an insight into market sentiment indirectly; for example, although the number of Daily Active Addresses refers to the activity of a network, we can understand that the more adopted the network is the higher its valuation in the market.
Limitations
Although the chain metrics offer us very valuable information for the elaboration of the fundamental analysis of a currency, I consider that some of them have great limitations for their application in analysis for short periods of time, providing signals that are unclear and difficult to interpret. This is a disadvantage for short-term traders, since they would not be able to rely on the analysis performed with the metrics.
Another limitation that I can observe is that for most of the metrics in the chain, the most recent data presented correspond to August, so we have a month difference with the current price, which is also a disadvantage for those seeking to perform an analysis of what is happening more recently, or if we want to evaluate a very new project, perhaps we will not find enough data.
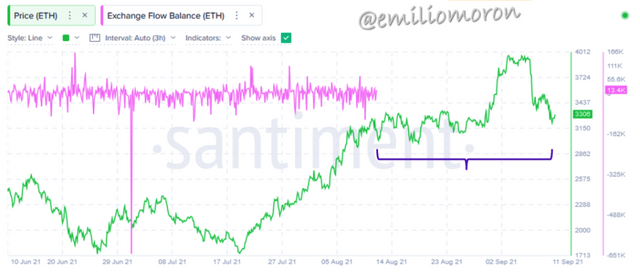
Source: Santiment.net.
The image above is an example in which we can observe that the Swap Flow Balance is difficult to correlate with the price for a short period of time, and as we can observe the information of this metric is presented until August 12, which leaves us a month without data in the graph.
On the other hand, they cannot be used as stand-alone indicators, since in some cases they are indirect data or do not reflect the full reality of operations, so they must be combined with each other and with other tools of fundamental analysis to determine the real value of an asset or the possible fluctuation of the price.
Conclusion
In summary, on-chain metrics provide us with data directly from the blockchain and are a very important tool to perform fundamental analysis of the value of a cryptocurrency we wish to invest in, with websites like Santiment being easy-to-use tools to obtain enough information to help us guide our investment decisions.
On-chain Metrics analysis correlates well with the price or value of a cryptocurrency, providing us with good signals to buy or sell the currency, especially when we base the analysis on long term projections.
Well friends I hope you liked my homework, a pretty deep review of on-chain metrics that has left us with important learning. See you next time!