Heikin-Ashi Trading Strategy-Steemit Crypto Academy | S4W2 | Homework Post for @reddileep
Good day all, today I will be taking my assignment for professor @reddileep in the Steemit crypto academy intermediate course program.

1- Definition of Heikin-Ashi Technique.
Heikin-Ashi is a Japanese technique based on the candlestick pattern mainly used for a higher level for trend determination. Heikin implies Average and Ashi implies Pace, Heikin-Ashi represents the typical pace of costs.
A Heikin-Ashi chart looks like the classic candlestick chart. but the calculation method and plotting the candlesticks on the Heikin-Ashi chart is different from the regular candlestick chart.
On the candlestick charts, each candlestick is independent and has no relationship with the previous or next candlestick. Yet, the Heikin-Ashi Candlesticks are independent and each candlestick is determined and plotted to Utilize some data from the previous candlestick.
The open price on a HeikinAshi Candlestick is the average of the open and the close price of the previous candlestick. The close price on a Heikin-Ashi CandleStick is the Average of open, close, High, and low prices. To get the high price on a Heikin-Ashi CandleStick chose from one of the high, open, and close prices with the highest value. The low price in a candlestick is chosen from one of the low, open, and close prices of which has the lowest value.

2- Differences between the traditional candlestick chart and the Heikin-Ashi chart.
I Visit TradingView.com To take a ScreenShot of a traditional candlestick chart and the Heikin-Ashi chart.
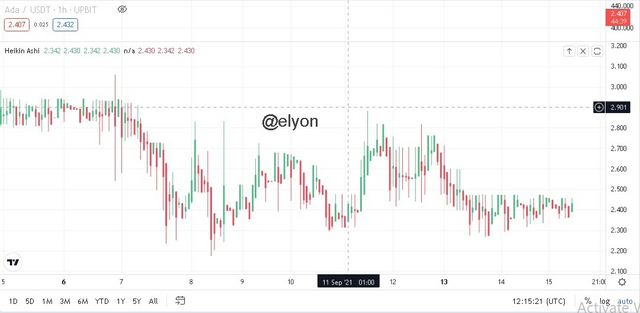
Heikin-Ashi Chart:
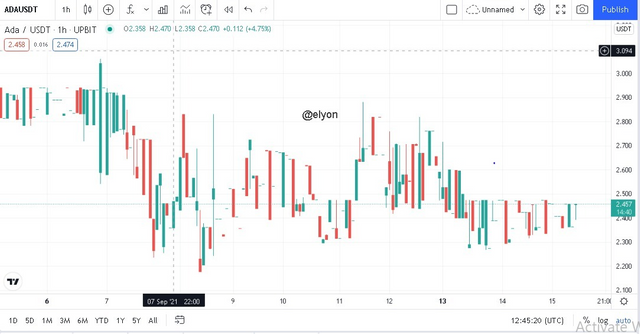
Traditional candlestick chart:
| Traditional candlestick chart | Heikin-Ashi Chart |
|---|---|
| The traditional candlestick chart looks a bit complicated. | Heikin-Ashi chart looks very smooth. |
| Traditional candlestick chart only shows volatility and trend. | Heikin-Ashi chart Shows volatility, trend, and signals trend reversals. |
| It just shows the current price. | It is utilized to predict the future cost of an asset. |
| It is very difficult to identify | It will be easy to identify. |
| CandleStick chart is faster than Heikin-Ashi chart. | Heikin-Ashi Chart is slower than a candlestick chart and its signals are delayed. They works like a moving average. |
3- Explanation of the Heikin-Ashi Formula.
Heikin-Ashi has 4 Types of data and It can be used for Calculation.
1) Heikin-Ashi Close
The Heikin Ashi Close is essentially a normal of the open, high, low, and close for the current time frame.
Heikin-Ashi-close= Open(0) + High(0) + Low(0) + Close(0))/4.
2) Heikin-Ashi Open
The Heikin Ashi open is the Average of the prior Heikin-Ashi Candlestick open + the close of the prior Heikin-Ashi Candlestick.
Heikin-Ashi Open = Heikin-Ashi Open(-1) + Heikin-Ashi Close(-1))/2.
3) Heikin-Ashi High
The Heikin-Ashi High is the hightest level of three point data, at the current period's top, the current Heikin-Ashi Candlestick start or the current Heikin-Ashi Candlestick end.
Heikin-Ashi-High = Maximum of the high(0), Heikin-Ashi-Open(0) or Heikin-AshiClose(0).
4) Heikin-Ashi Low
Heikin-Ashi low is the minmum of three information focuses the current time frame's low, the current Heikin-Ashi candlestick open, or the current Heikin-Ashi candlestick close.
Heikin-AshiLow = Minimum of the Low(0), HA-Open(0) or HA-Close(0).
4- Graphical explanation of trends and its buying opportunities through the Heikin-Ashi Candles. (Screenshots required)
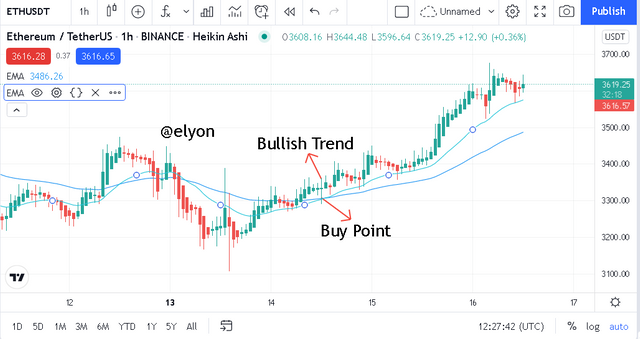
Heikin-Ashi Candlesticks can be used to identify trends in the market. Most Profits are generating when the market is in Trending. There are many ways that can help you to spot a trend one of the best approaches is with Heikin-Ashi CandleStick. When the Market is Bullish, Heikin-Ashi candlesticks have a big bodies and long Upper shadows but, no lower shadows.
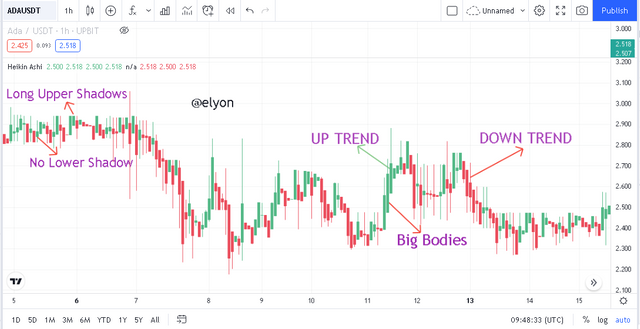
In a bearish market, the candle sticks are of big bodies lower shadows below and no upper shadows. This tell us that the bearish momentum is strong.
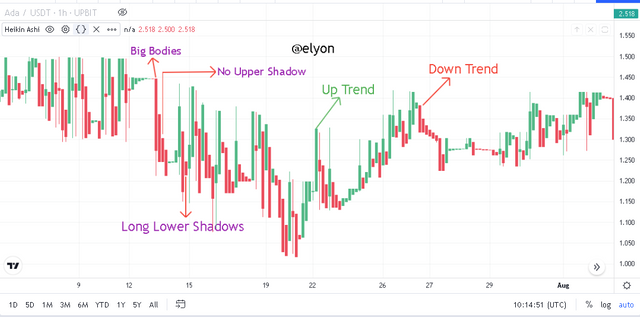
So, In Short When Prices are trending up, Heikin-Ashi bars have no longer shadow, When the prices are trending down, Heikin Ashi bars have no upper shadow. Heikin-Ashi Chart is much smoother looks in terms of price actions, Easier to identify trend and profit from it.
5- Possibility of transacting with only signals received using the Heikin-Ashi Technique? Reasons.
The Heikin-Ashi Techique is not 100% Reliable. So, My answer is No, it is not possible to transact only with signal received using the Heikin-Ashi Technique because of some Reasons. First of all cryptocurrency is an unpredictable market that can change her price in any case, it is therefore always good to combine one or more indicators for more accuracy.
Heikin-Ashi Provides Good Signals in Markets The Heikin-Ashi Charts creates a much smoother flow of price movement without the gaps and the choppy movements typical price action can make. It is easy to read trends in markets both the size, Direction and color of a Heikin-Ashi Candle stick will tell you alot about the trend in a short amount of time. But also it gives false signals in the market.
6- Performing both Buy and Sell orders using Heikin-Ashi+ 55 EMA+21 EMA with a demo account.
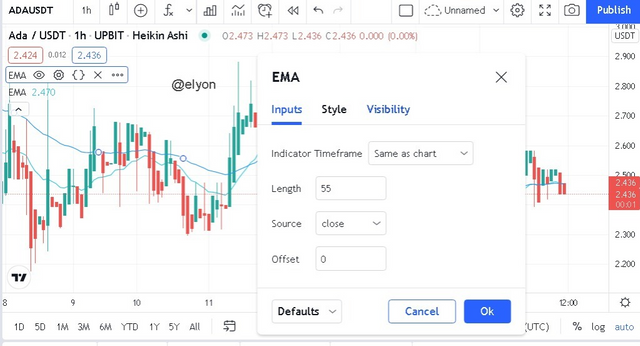
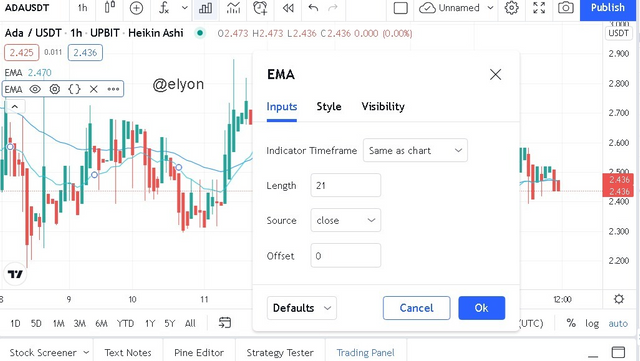
I Visit TradingView.Com then add two Moving Average Exponential EMA
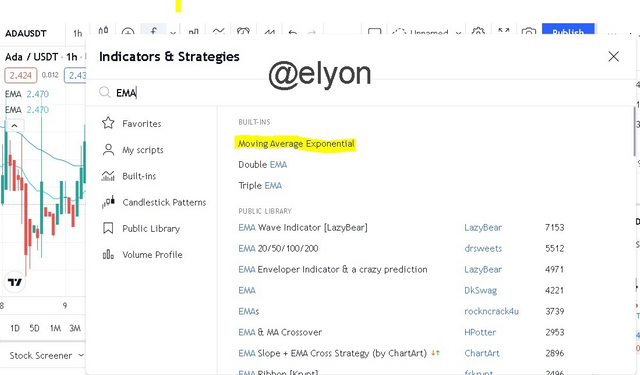
Then Change her Lengths to 55EMA and 21EMA
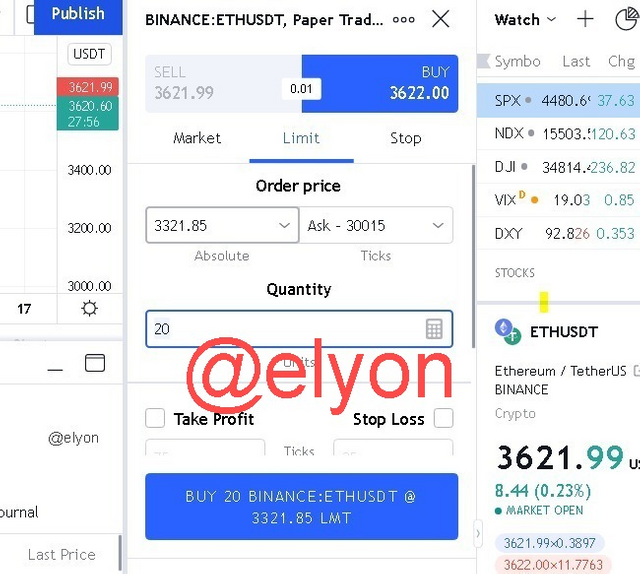
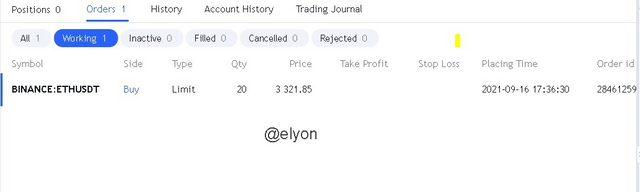
Buy Trade ETH/USDT
I Will See that the market is in Bullish Trend Price will be going upward So
Now, I Purchased an order at 3621
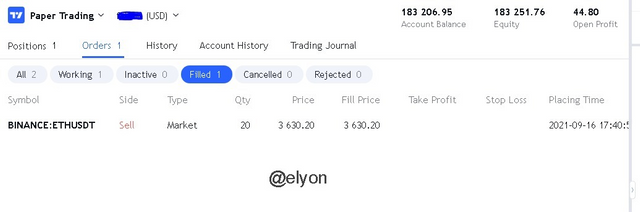
Sell Trade ETH/USDT
After sometime i will sell this at the price of 3630.20.
Conclusion
Thank you professor @reddileep for this informative and insightful lesson.
Respected mention
Regards,
Hi, @elyon,
Thank you for your contribution to the Steem ecosystem.
Please consider voting for our witness, setting us as a proxy,
or delegate to @ecosynthesizer to earn 100% of the curation rewards!
3000SP | 4000SP | 5000SP | 10000SP | 100000SP