Crypto Academy Season 4 [ Advanced course ] week 2: Crypto Trading With Volume Indicator By @elyon
Good day all, today I will be taking my assignment for professor @kouba01 in the Steemit crypto academy Advanced course program.

1. Explanation of the volume indicator.
A volume Indicator is a Technical Indicator or you can say it is a graphical indicator. It represents the amount of an asset being traded in the market in a particular time period.
Volume indicator is represented in the vertical boxes or bars of different sizes, which can be understood at the bottom of the chart. and these bars are of different sizes, It depends on the Volume of the Assets. The assets exchanges volume is shown by the size of the volume bar. In case if there is high exchanging in the market, the volume bar would be long and in case if there is low exchanging in the market, the volume bar would be little. In the Volume indicator, there are two colors in the volume bar which are green and red. The Green Color Volume bar shows high trading volume than the previously closed candle. and the red color volume bar shows that the trading volume of the current time period is lower than the previously closed candle.
Volume indicators are mathematical formulas that are visually represented in almost all trading platforms. Each indicator uses a slightly different formula, and therefore, you should find the indicator that works best for your particular market approach. Volume Indicator can help you a lot in your trading decision process.

2. Presentation of the volume indicator and how parameters are configured
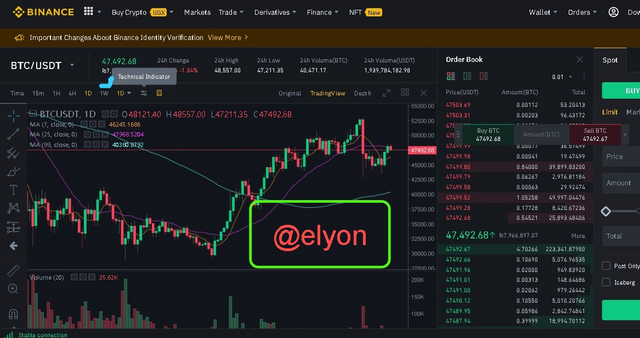
To Add Volume Indicator in a chart I Visit Binance.com
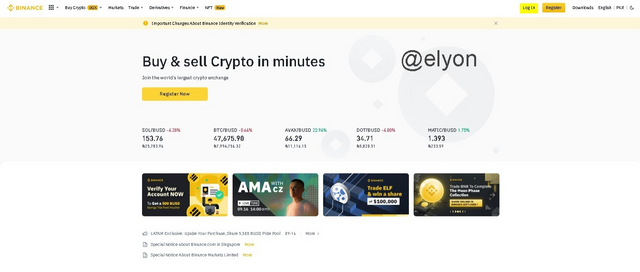
First of All I Will Login to My Binance Account. then click on trade after clicking on trade Click on Advanced.
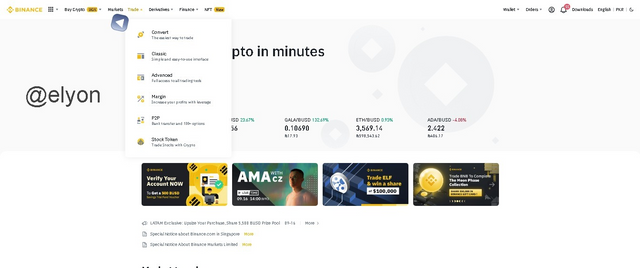
Here, I will Proceed to the Trade page.
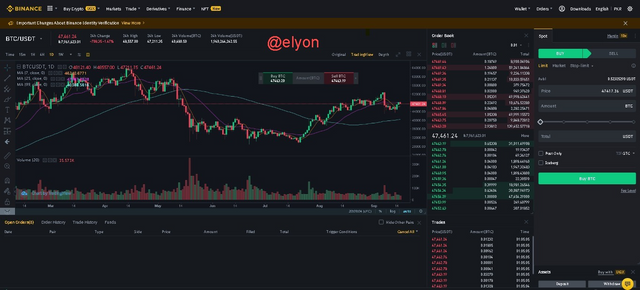
As Shown in the Picture Below: Click on Technical Indicator.
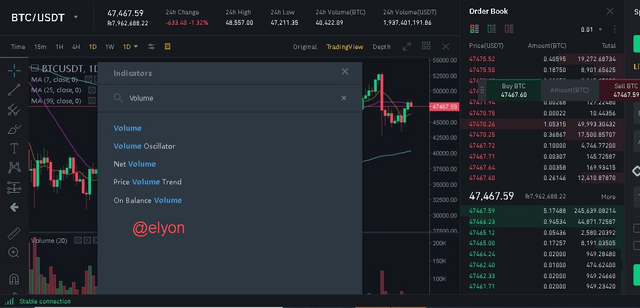
Then Search Volume After Clicking on Search there having some options Here Click on Volume. Then Volume Indicator Successfully Added to the Chart.
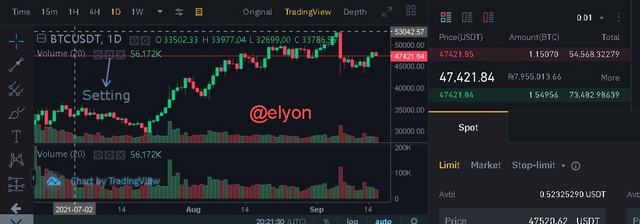
After the Volume Indicator is Successfully Added to the chart then click on setting As Shown in the Picture.
After Clicking on Setting You can change the MA Length as You Want to change. I just click on Ok. as MA Length is 20. It means the Average of 20 Days.
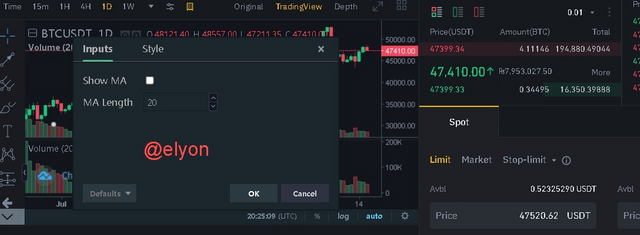
Here in the setting, there was also an option to change the style of the Volume indicator. Here You can change their color as You want. As I Change the color to red-green and Blue
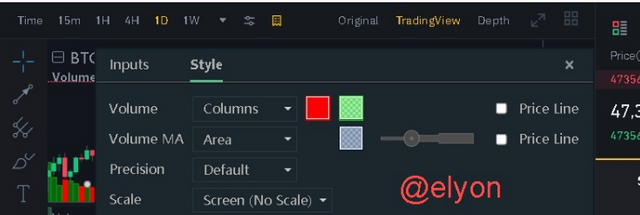
As You can see that after all configurations this was the final look of the Volume Indicator.
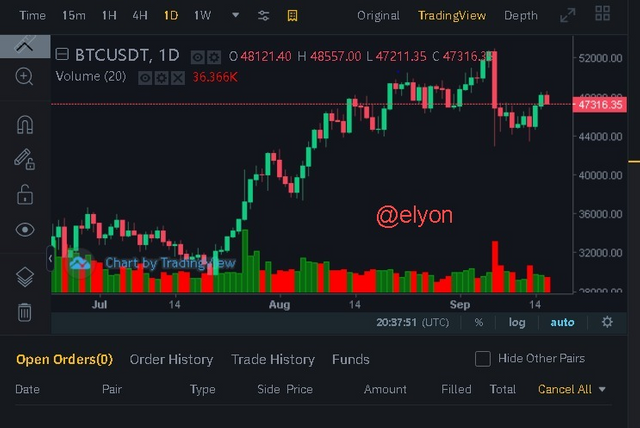
3. Link between Volume and Trend and How volume is used to predict a trend reversal? (Screenshot required)
Link Between Volume and trend
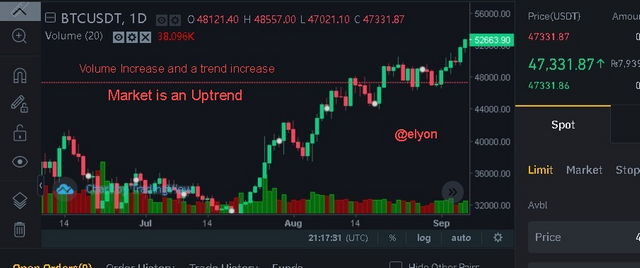
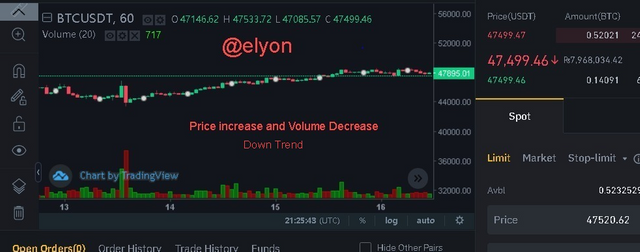
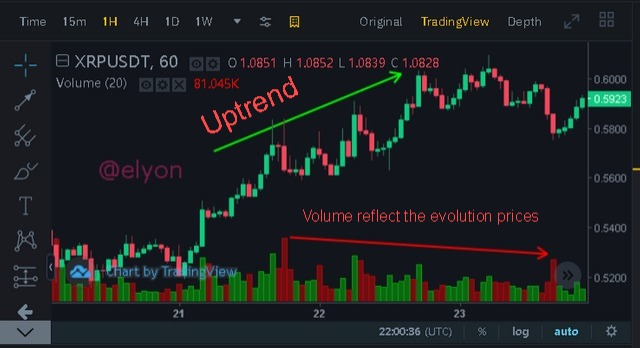
Volume is a technical Indicator When we linked Volume and Trend we can able to explore the direction of the trend. When we Linked volume and trend, it will become more dependable. When Volume increases so, the prices will also be an increase It means that the trend is bullish and when the price decreases so, the Volume will also decrease. There is an Uptrend in the market at both increase and decrease. When Price will increase and volume decrease then it means that there is a downtrend in the market. It means that the trend is Bearish. When Volume Increase and the price will also increase then there will be a Bullish Trend.
When Volume increase and the trend will also increase so there is an uptrend in the market.
When the price increased and the volume decreases it means that there will be a downtrend in the market also when the price decrease and the volume increase it means that there will be a downtrend in the market.
How volume is used to predict a trend reversal?
Trend Reversal can be recommended by the Volume Indicator. and it can happen when the price will be decreased and the Volume will also be decreased it means that this is the Bullish trend. At that minute seller starts selling their asset.
At the point when the price is in a bullish trend, and the volume decreases, this suggests that there is a restricted presence of purchasers in the market to help the bullish trend. This causes a different structure between the volume indicator and the price movement.
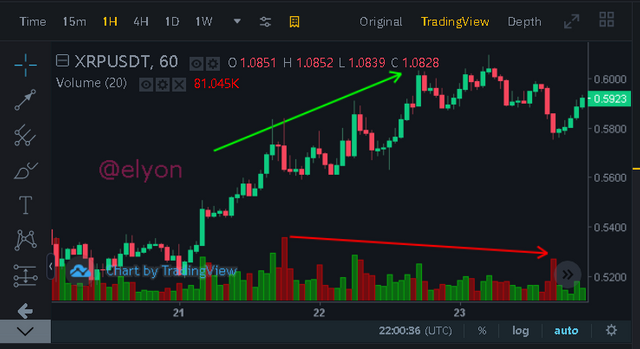
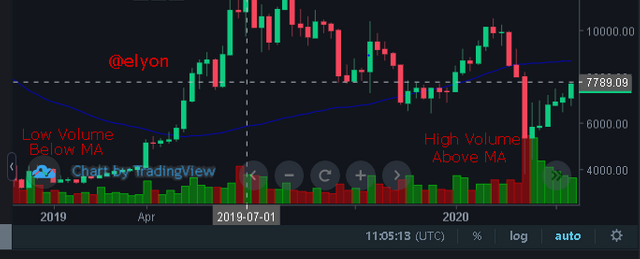
Here I Will Show the example of XRP/USDT on 1Hour time frame Here we can see that the price is moving up, the volume of an asset is decreasing so, the market is in a bearish trend.
4. Using the Volume for signal confirmation? (Screenshot required)
Volume by price is an overlay that can be used to identify current that Gives signal confirmation by two levels i.e Resistance level and Support Level.
Resistance level
When the volume is weak at a resistance level then there will be more chance that the price will move down. When the prices will be increased through the resistance level and at that time volume bar also increase so, it means that the market is in a bullish trend.
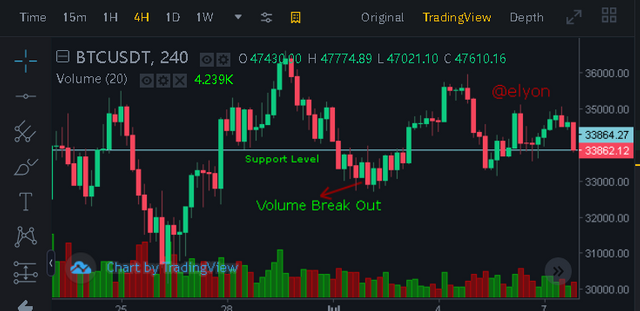
Support Level
When the prices stop down the support level and the volume bars are strong then break out is confirmed. It means that the market is bears are in charge. But if the Volume bar is weak then it means that the price would likely go back.
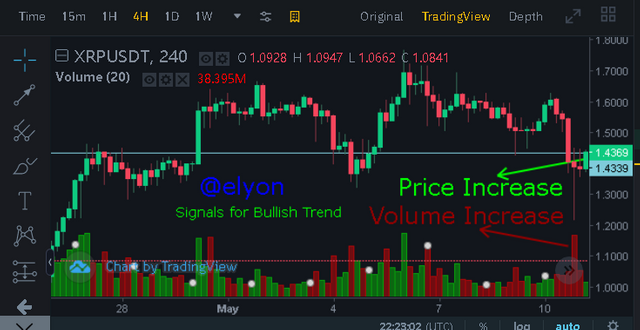
5. Reflection of the volume and evolution of prices in the charts. Why volume may anticipate price? (Screenshot required)
Volume Reflects the number of traders involved in trading. If the volume bar increases it means that the traders are easily able to get their trades completed. When we talk about an uptrend in the upward direction the volume moves in an upward direction. Volume increased in an asset means that there is a Higher Buying Pressure.
In a Downward trend, the price will be going up or down but the volume is going down it means there will be a downtrend in the market in a downtrend we observe that the volume price is downward movement.
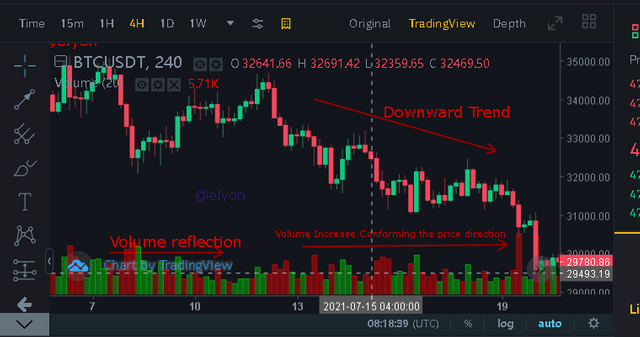
In the volume Divergence, the traders are not following the trend so, the volume anticipates the prices it means that the market will show the trend reversal.
6. Which is better? Using the volume indicator alone or in parallel with another indicator? Justification
Every indicator is good, But, It is not better to use a volume indicator Alone with another indicator, Because No indicator is 100 % Reliable But Yes it is better to use a volume indicator in parallel with another indicator. Volume is a very powerful tool but it is often overlooked. Also, Volume information can be found on any trading platform, but strangely few traders or investors know how to use this information to and maximize profit.
Volume is not a definite entry and exit tool, However with the help of some volume indicators, you can generate decent entry and exit signals by combining them with price action or other tools.
We can not use it alone if we take an example that volume indicator just shows the Volume for any crypto that how much demand how much purchased the coins by buyers. When Many people buy coins then the volume will increase and when less people there will be decreased in volume. So only for that reason, we can not see the signal for every crypto so if we use two or more indicators like RSI MSAD, etc then it will be better as parallel.
7. Usefulness of one of the volume indicators in crypto trading.
There are many Volume indicators I will be discussed for the Average Volume Indicator and the volume Momentum Indicator.
Average Volume Indicator
The most basic of all indicators is the Average Volume Indicator. and the calculation most commonly used for the stock market is 50 days, although it may be reasonable to use the same period as the price average that will be used. Then if you are tracking the 200-day moving average for instance a 200-day moving average of the volume would make sense anything less than 50 days is not likely to be smooth
Volume momentum:
I am talking about a useful indicator which is Volume Momentum. The Volume momentum indicator treats volume as it would be price. For momentum, it means finding the change in volume over a specific time interval, Volume Momentum indicator basically measures the size of the volume change relative to the starting value. This indicator sorts the volume supported negative or positive closes. This indicator works in all time frames but it is quite strong in the smaller ones to notice buying or selling price taking place.
Conclusion
Volume is a good indicator Here in this lecture we can learn many things about Volume. Thank you professor @kouba01 for this informative and insightful lesson.
Respected mention
Regards,
Unfortunately @elyon , your article contains plagiarized/Spun content
Rating Total|0/10
Source:
https://www.investopedia.com/articles/technical/02/010702.asp
The Steemit Crypto Academy community does not allow these practices. On the contrary, our goal is to encourage you to publish writing based on your own experience (or as per the mission requirements). Any spam/plagiarism/spun action reduces PoB's idea of rewarding good content.
Thank you.
Cc: -@endingplagiarism @sapwood
Thanks Prof I intended to read and rewrite with my own words, must have been my been in a hurry, it won’t happen again.