Crypto Academy / S4W4 - Homework Post for Professor @kouba01
Good day all, today I will be taking my assignment for professor @kouba01 in the Steemit crypto academy Advanced course program.

Q.1. The Williams %R indicator, how it is calculated, how it works? the best setting? With justification.
The William % R indicator Known as the Williams Percentage Range indicator. It is a momentum indicator that was originated by Larry Williams in 1973 which was known as a commodity trader. Inside it is an oscillator line. William % R indicator shows Overbought condition and OverSold Condition. It is used to identify the Market trend i.e Overbought and Oversold signals. If the market is on an uptrend it means that It is an oversold signal. and when the market is in a downtrend it means that it is an overbought signal. This indicator goes between 0% to -100%. An analysis above -20% is overbought. An Analysis below -80% is oversold.
How it is Calculated
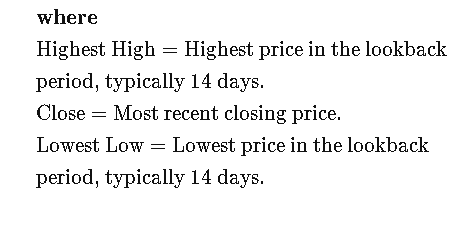
The William %R indicator can be calculated by the following formula.
Source
Example
Highest High Value for the last 14 days = 500
Closing Price Value for the Last 14 days = 410
Lowest low value for the last 14 Days = 400
Williams %R = Highest High - closing price / Highest High- Lowest low × -100
William % R = 500-410 / 500 - 400 x -100
William % R = -90
It means that the market is in Oversold condition.
Working
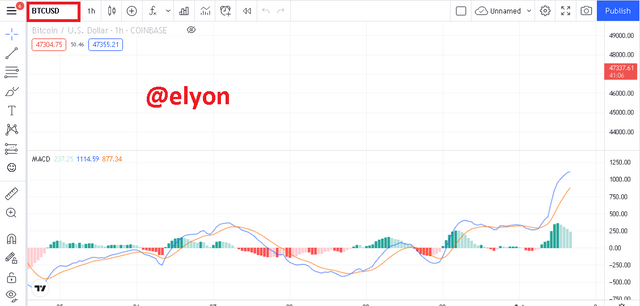
For Working I am Visiting TradingView.Com
Steps
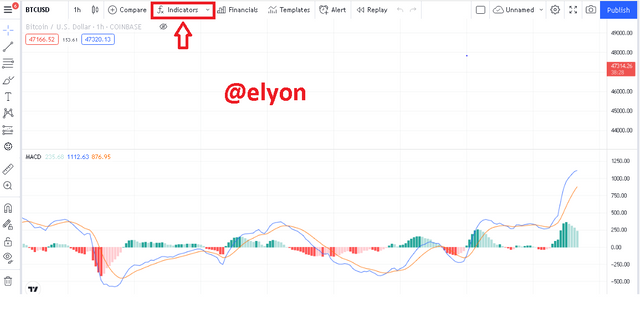
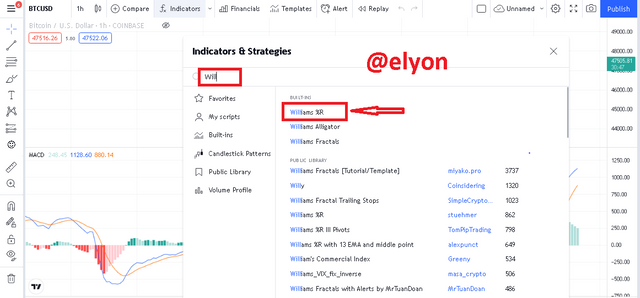
- Select any Pair of Assets.
- Click on Fx Indicator.
- Search the William % R indicator after a search click on it.
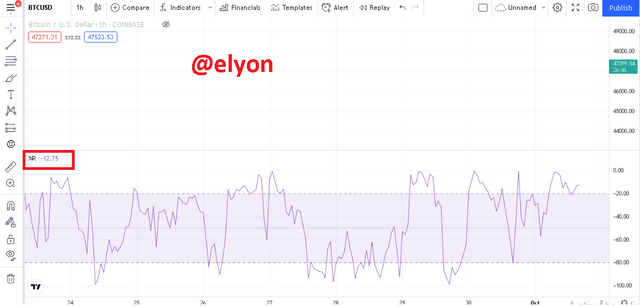
- The Indicator was successfully Added.
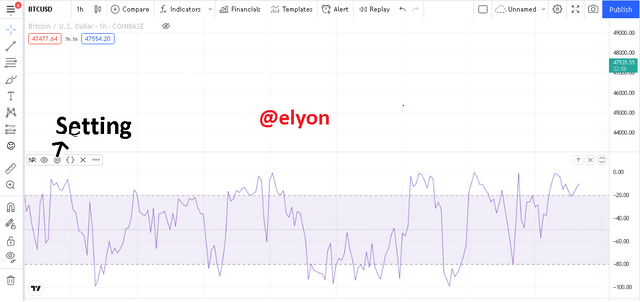
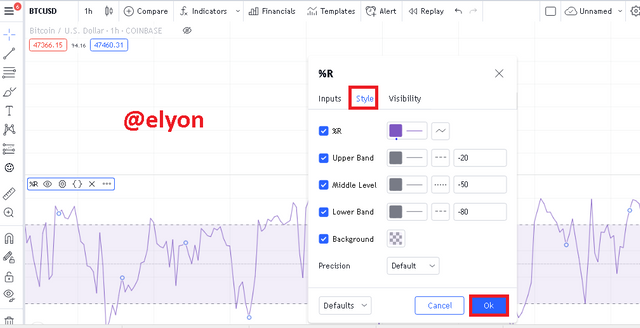
- Click on Setting of the indicator then change the style, length, color, etc you want to change.
- Select any Pair of Assets.
- Click on Fx Indicator.
- Search the William % R indicator after a search click on it.
- The Indicator was successfully Added.
- Click on Setting of the indicator then change the style, length, color, etc you want to change.
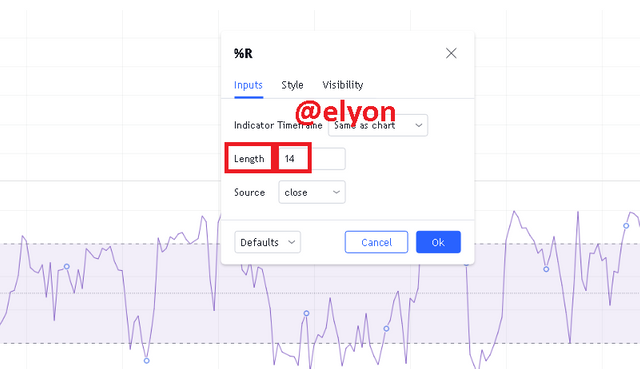
The Best length for the indicator is 14.
For changing Color click on Style then change the color also the background color if you want to change it.
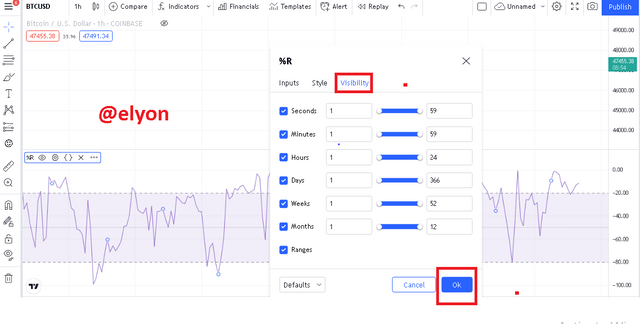
For Change the visibility clicks on Visibility and then change the time periods.
The Best setting for the indicator is length 14.
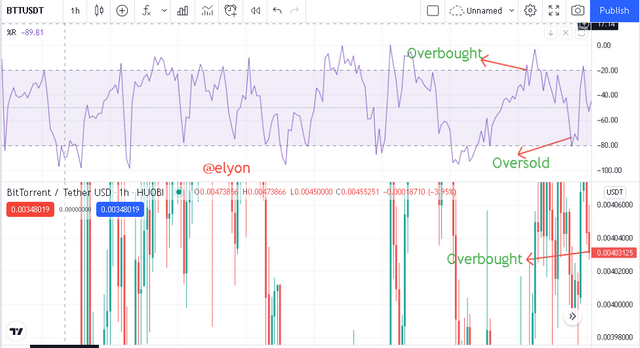
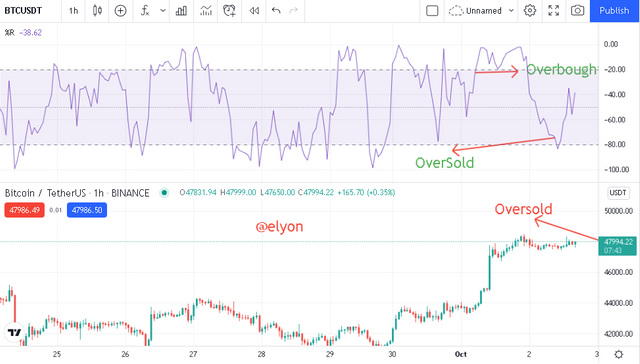
Q2. Interpretation of overbought and oversold signals with The Williams %R when trading cryptocurrencies?
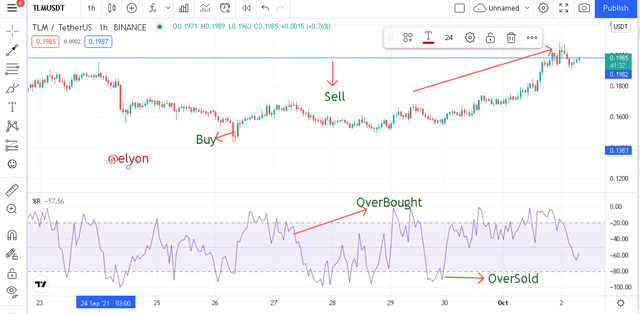
This indicator goes between 0% to -100%. An analysis above -20% is an overbought condition. An Analysis below -80% is an oversold condition. As shown in the pair of TLM/USDT Market is going in an uptrend It means at that time Market is an Oversold.
Q3. "Failure swings" and how to define them using The Williams %R?
In Failure Swings, It happens that the price goes up suddenly then due to the weak trend it goes down then again goes up then again goes down. It happens with it that's are called failure swings.
It will be in your bullish market and also in the bearish market.
In the Bullish market, it is like that the price is going up then going down then up then down. But in the Bearish Market, the price fell down then goes up...
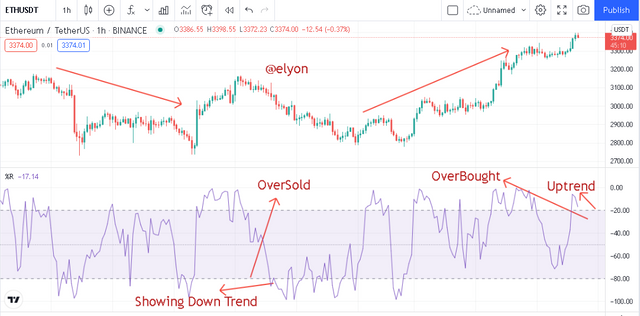
Q4. Use of bearish and bullish divergence with the Williams %R indicator.
Divergence is that It happens that the price goes to one place And suddenly go down. So, in the William chart we see that price will go down and in the price chart we will see that the price is going up and after sometime the price will go down. So, this is Divergence.
When the Market is in Down trend it means that the Market is in Bullish Divergence. There the Price is an Overbought it means that the price is Low.
When the Market is in Up trend it means that the Market is in Bearish Divergence. There the price is a Oversold Means the price is Very High.
5. Spotting a trend using Williams %R? Filtering False Signals? (screenshot required)
False signals are filtered as if we use another indicator with them like EMA. By Using EMA it will be filtered. For Spot Trend I just say that when the William % R Price up will be Up when the William Down Price will also be Down.
It is a momentum indicator that is used to identify the Market trend such as bullish, Bearish also a trend Reversal. I have already set the length to 14. and, This indicator goes between 0% to -100%. An analysis above -20% is overbought. An Analysis below -80% is oversold.
6. Using a chart of a pair to present the signals from the Williams %R indicator.
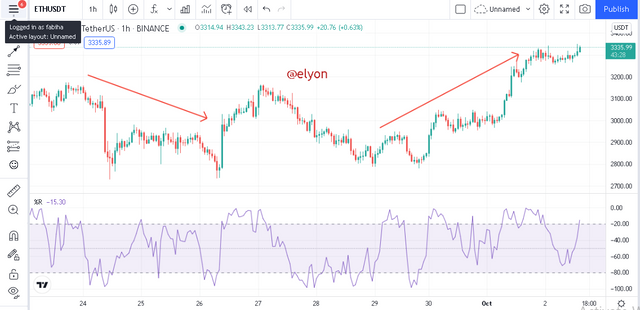
For this question I am using the chart of steem/eth.
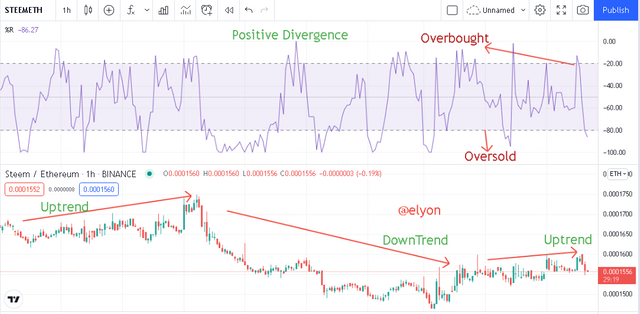
In this chart I see that the price is going Upward But after sometime When I Getting Screenshot the price will be moving downward. I means that it is an overbought Signal. I Will present all the signals in the screenshot.
Conclusion
Thank you professor @kouba01 for this informative and insightful lesson.
Regards,
Hello @elyon,
Thank you for participating in the 4th Week Crypto Course in its 4th season and for your efforts to complete the suggested tasks, you deserve a Total|3.5/10 rating, according to the following scale:
My review :
An article with under-average content that lacks a clear methodology in analyzing the information provided.
A brief interpretation of the indicator and its characteristics.
You did not explain how to find out the trend reversal using the WPR indicator.
The rest of the answers were not accurate and effective enough to address the generalities without entering into the details.
Thanks again for your effort, and we look forward to reading your next work.
Sincerely,@kouba01