Steemit Crypto Academy | Season 3: Week 7 || How to create an account on TradingView, how to use indicators,tools, features of tradingview by @eloksjoseph
INTRODUCTION
Hi guys, welcome to a new week on steemit crypto academy. Today I'll be asking an assignment post based on the assignment given by professor @yousafharoonkhan on Trading view,it's features and it's tools.

Define the TradingView site and how to register an account in tradingview? what are the different registration plan?(screenshot necessary)
TRADING VIEW
Tradingview is a platform created in 2011 to enable traders and investors access to charts of various markets - crypto, forex , stocks, etc- as long as their connected to the internet on their mobile device, laptop,computer ,etc. Trading view can be assessed via the site or the application. Both means serving the use needed.
As we have said before, trading view is a trading platform and it contains a wide range of features that enable the trader get the maximum information he needs on a particular market.
Trading view also contains certain tooks like indicators e.g. the Bollinger bands, RSI graph, ADX indicator, etc that gives traders edge in the financial market. Trading view even has a special place where a traders who are just starting can watch others trade the live market.
Another thing most people who us trading dont know about is the ability for them to chat with others . You could either chat in a public chatroom or join a private chat . This then rounds up trading view as a social network, a site for trading , a kind of manual where you can learn how to trade etc. Still putting the users under consideration,there's an help center you can contact if you're having issues navigating the site.
Let's see how to register for trading view.
HOW TO REGISTER FOR TRADINGVIEW
Registering for trading view is really easy and can be done in the following steps.
- Go to your browser of choice and search for Trading view.
- Click on the link to the site. www.tradingview.com

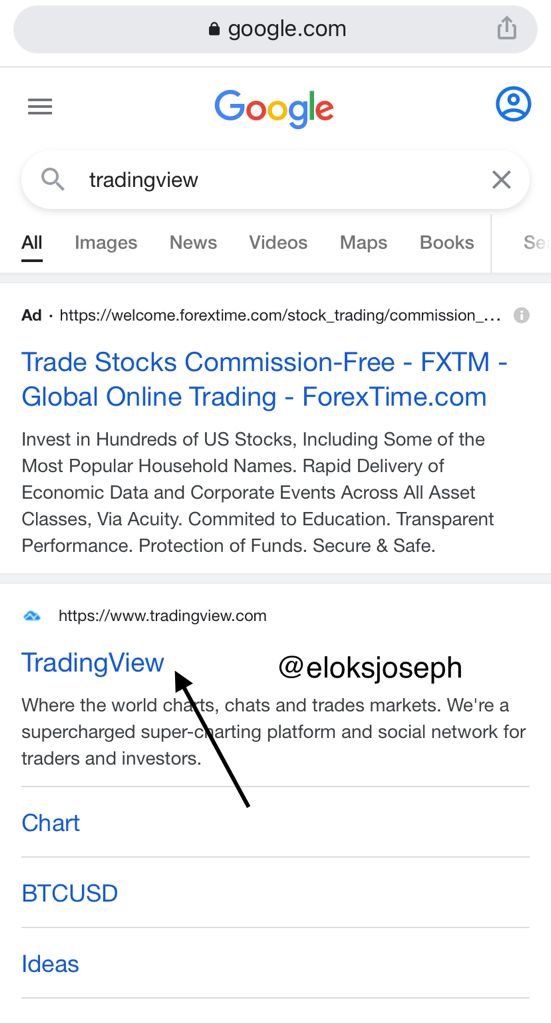
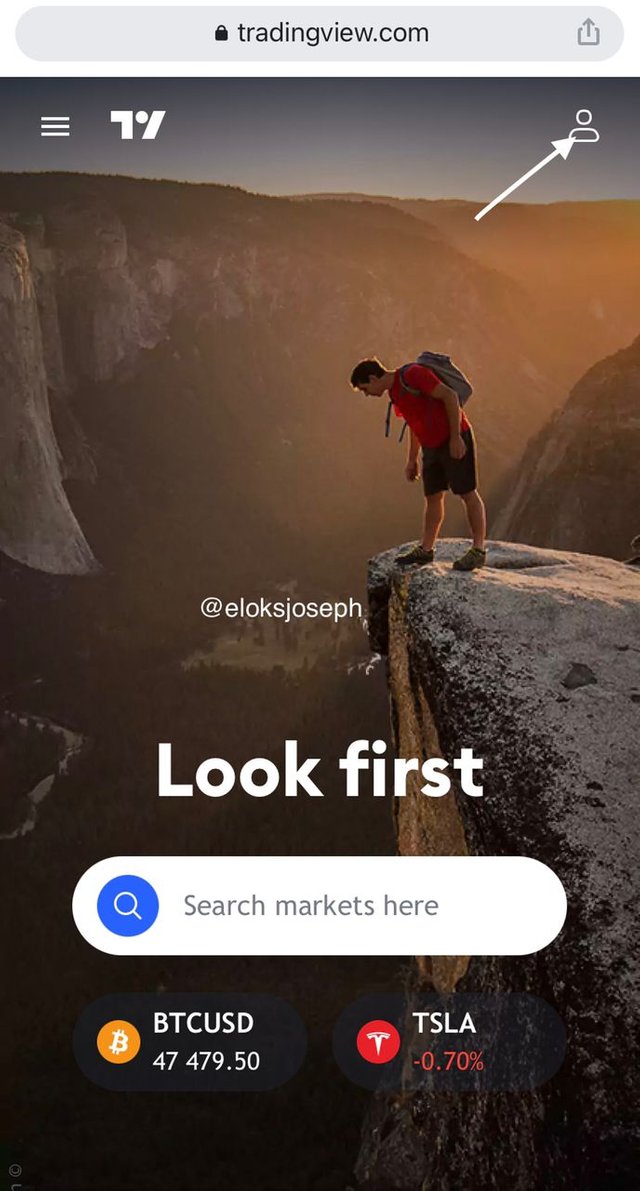
- On the top right corner, there's an avatar looking tab. Click on it.
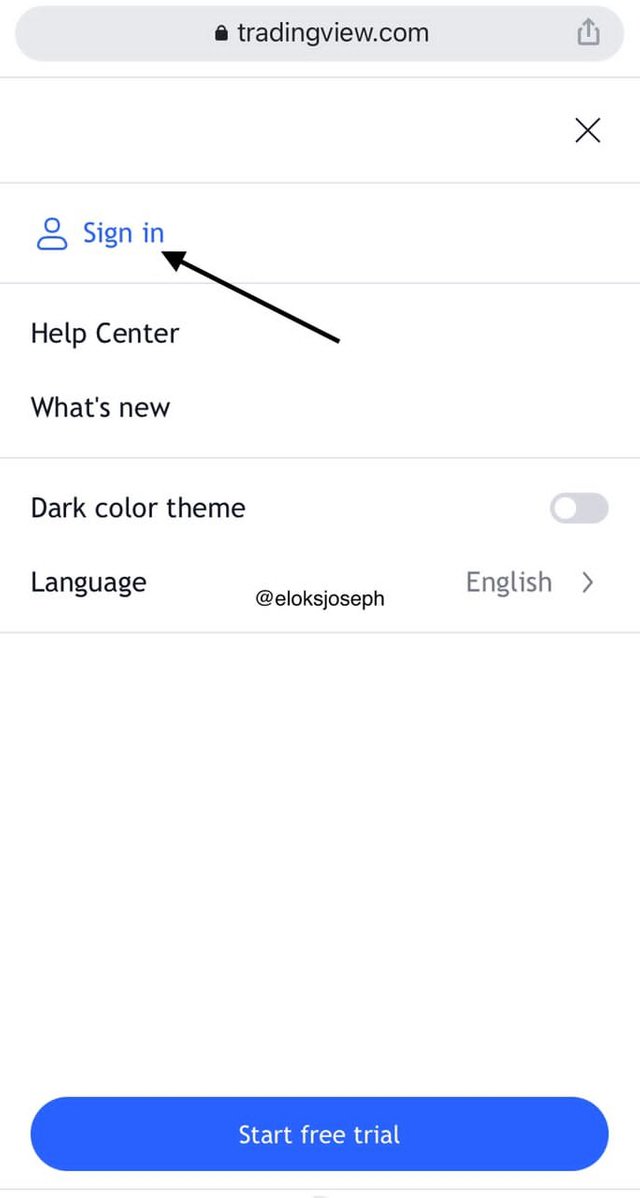
- You'll see options like sign in,help center ,what's new ,etc. Click on sign in
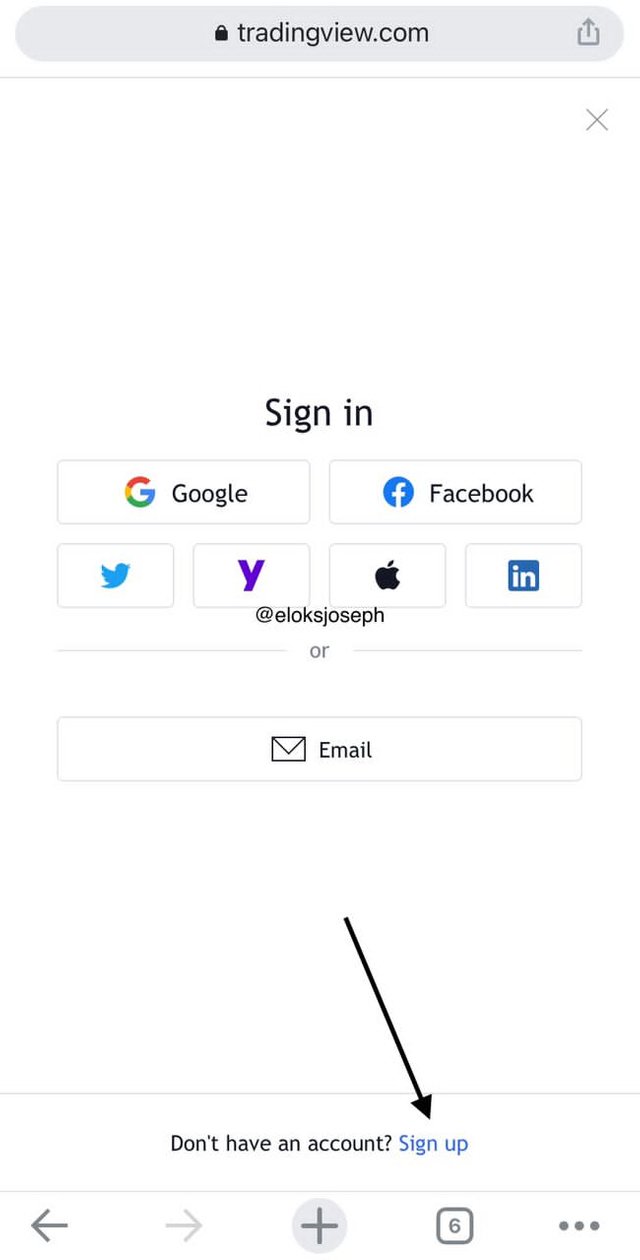
- Here, we'll see various options to sign in . But we don't have an account yet and we want to create one so we'll click the sign up tab instead.
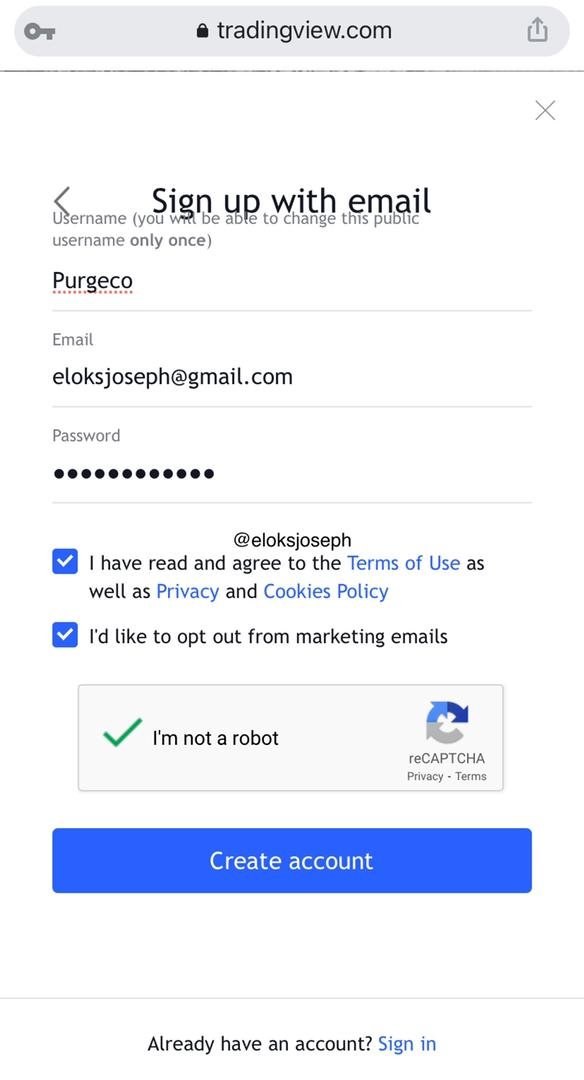
- You can find this at the bottom of the page. You have various options to sign up with . But I'll be using Gmail.

You'll be asked to input a username of your choice, input your email and set a password.
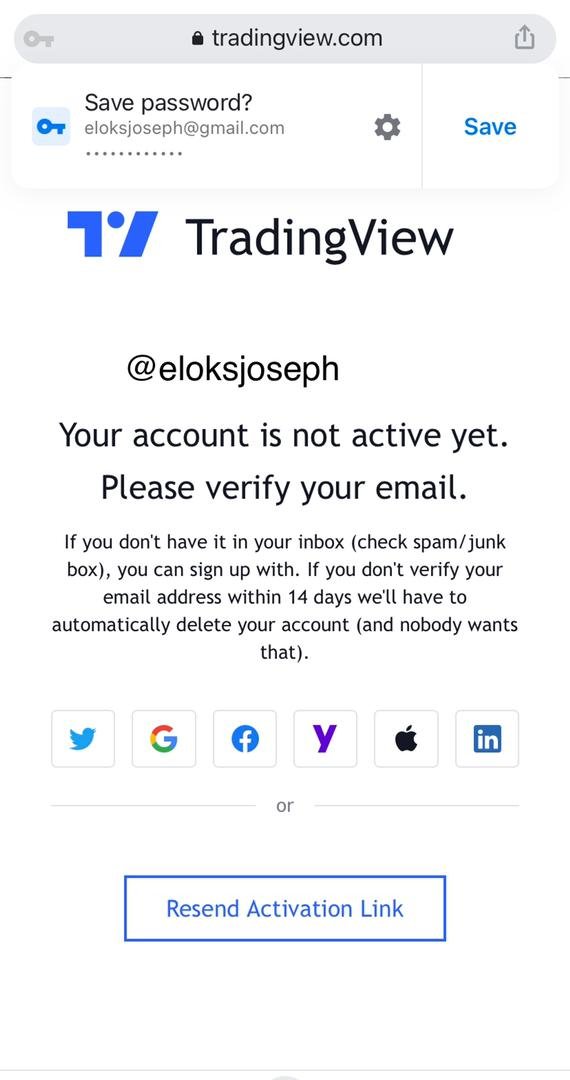
Then you'll be asked to activate your account which will be done by clicking on the link sent to your email account.
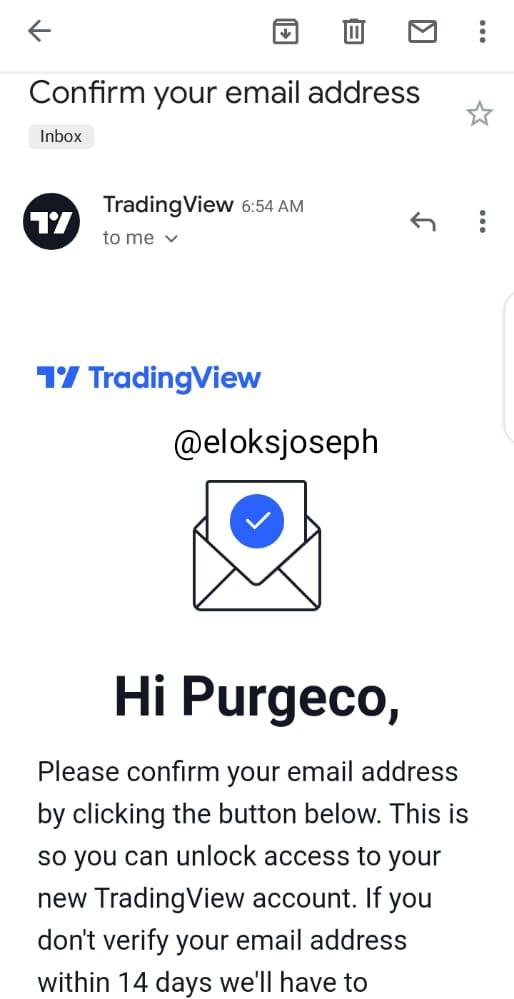
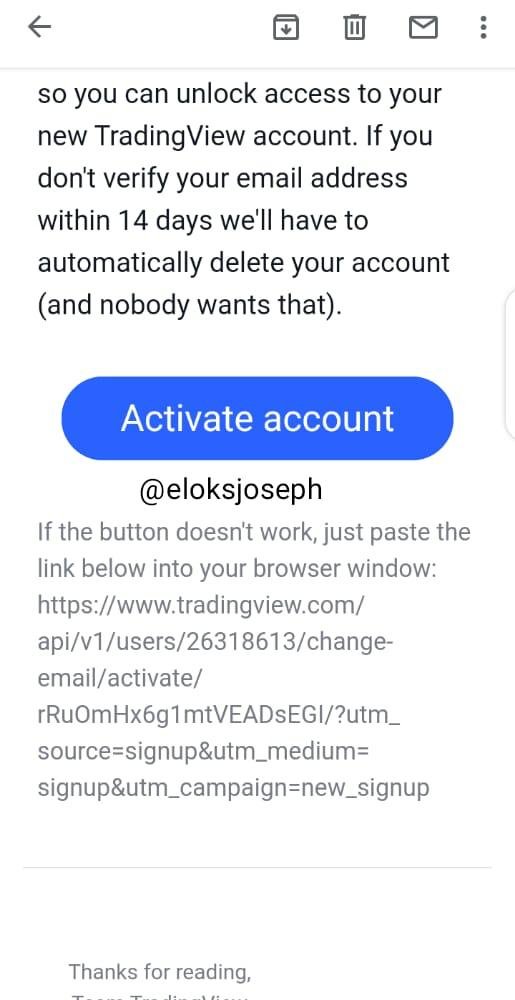
- Open the message they sent and you'll see the activation link. Click on it to activate your tradingview account.
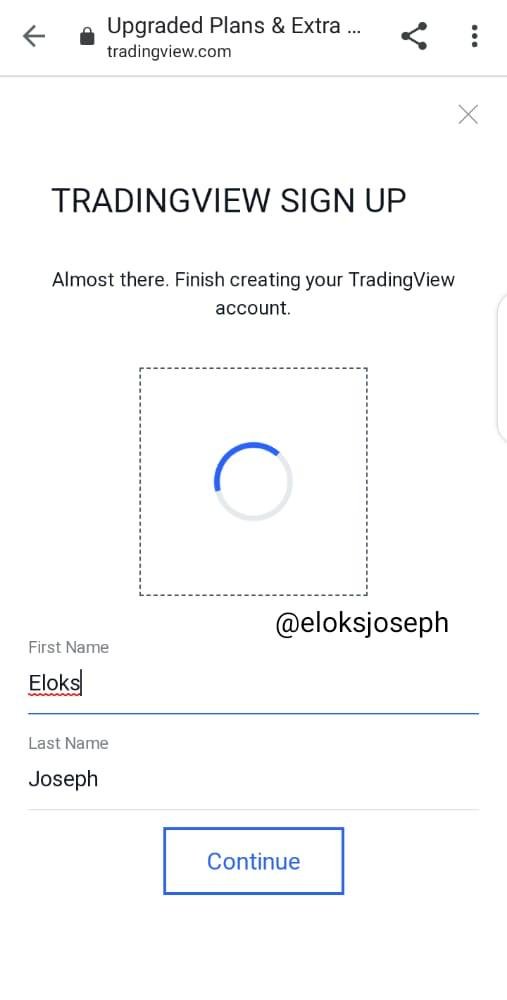
You'll be required to pick a profile picture and then input yor full name
And in those few easy steps,you've created a tradingview account. You can check the too right corner for your account details.
- Here you can do your profile settings, manage billings on your account ,etc.

Now that we have shown how to create a trading view account, let's see the different registration plans available.
REGISTRATION PLANS ON TRADING VIEW
There are 2 types of registration plans available on Trading view. They are;
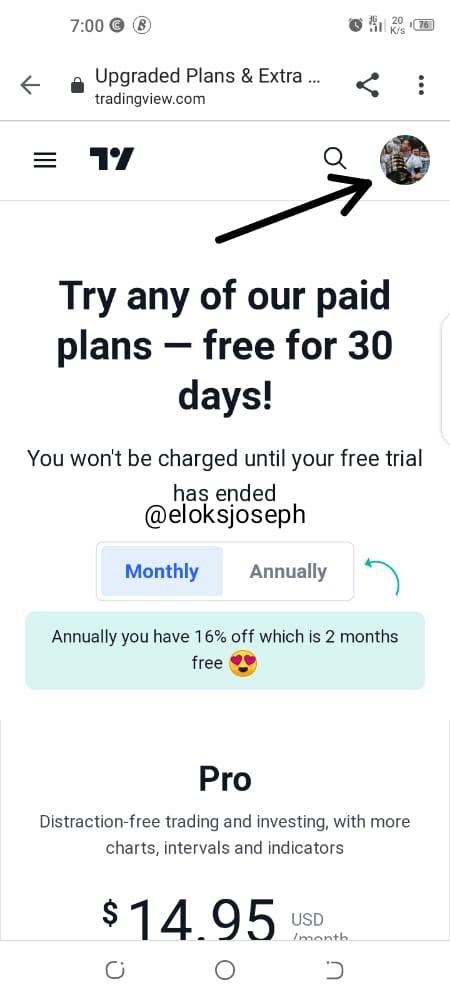
MONTHLY PLAN;
Tis plan involves subscribing for added features onna monthly basis and it is sub divided into 3 ; pro,pro+ and premium.

The pro plan includes the ability to use up to 5 indicators in one chart, ad free usage, 2 charts in one window , etc.
The pro + allows the user to access up to 10 indicators at the same time , up to 4 charts in one layout,and unlike the pro where it is limited to one device , you can have 2 devices using one account in the pro+
The premium is the highest of all 3 as the name implies. It allows up to 25 indicators, 8 charts in one layout,and unlike the pro + ,the premium package allows you use 5 devices simultaneously.
ANNUALLY

The annual plan is a yearly subscription Okan available to every user of trading view. It also has the pro, pro+ and premium packages. All these packages have the same features with the pro, pro+ and premium packages of the monthly subscription respectively. The only difference is the 16% discount given by tradingview to annual subscribers.

Explain the different features of tradingView and what is your favorite feature and why?(screenshot necessary)
Tradingview includes a lot of important features which include;

CHART
This is the most important feature of TRADINGVIEW and also the most used feature. It includes historic chart data, you can also access various indicators in this feature which is very useful to traders.

TRADE
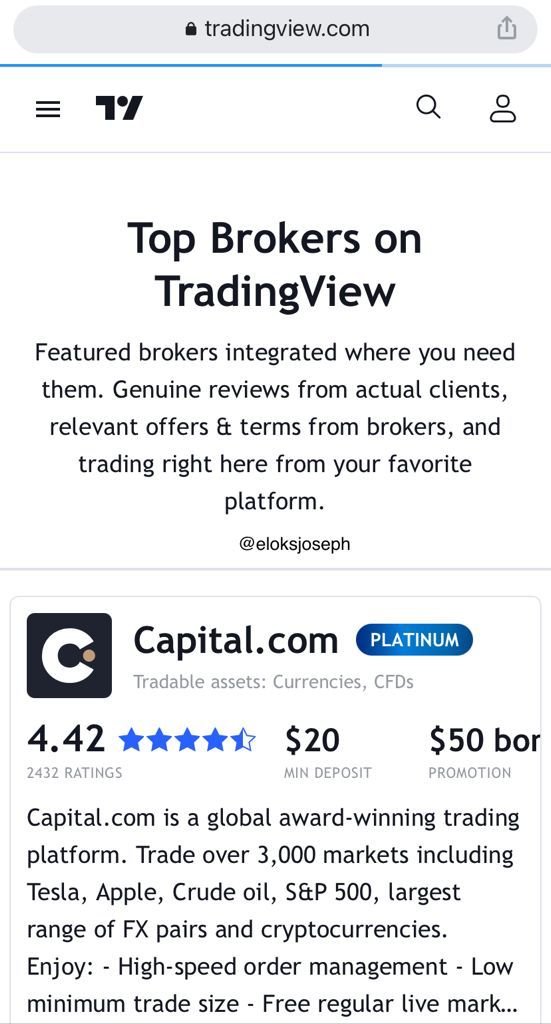
Trade is divided into top brokers and broker awards.

Top brokers as the name implies are the trading apps that are under the support of trading view. They are the brokers they provide their users to trade with. They include capital.com,currency.com,etc
Broker awards as the name implies are the awards given to the best brokers , social champion,etc

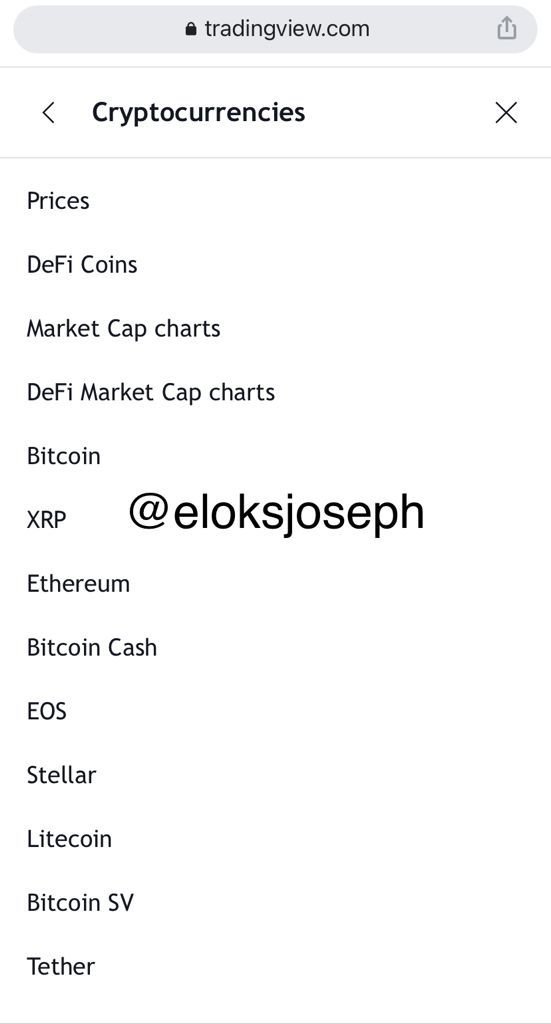
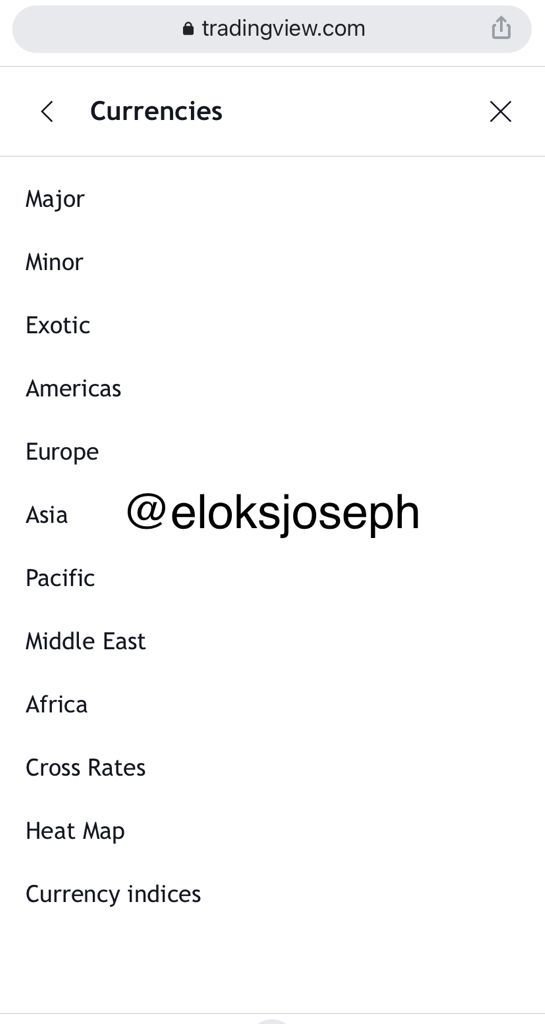
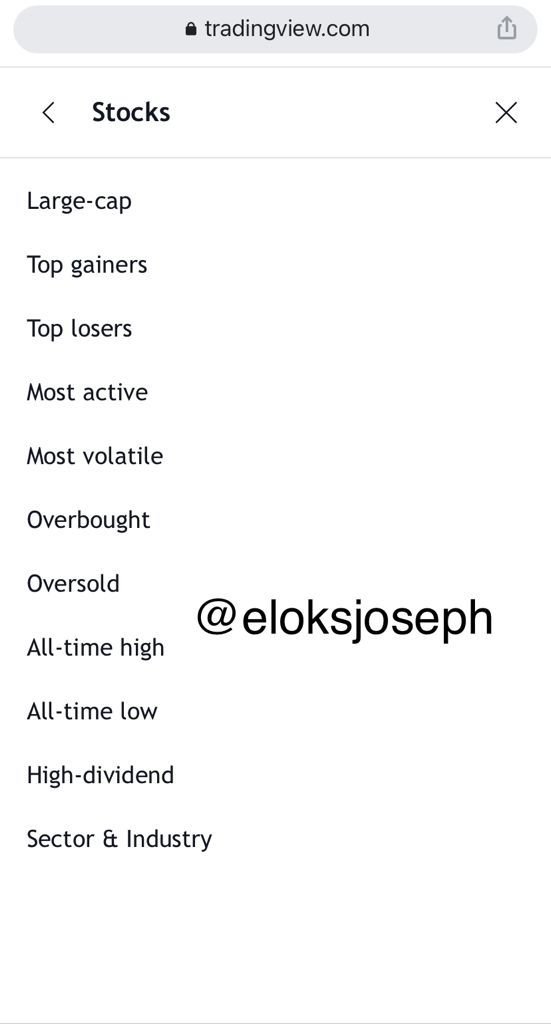
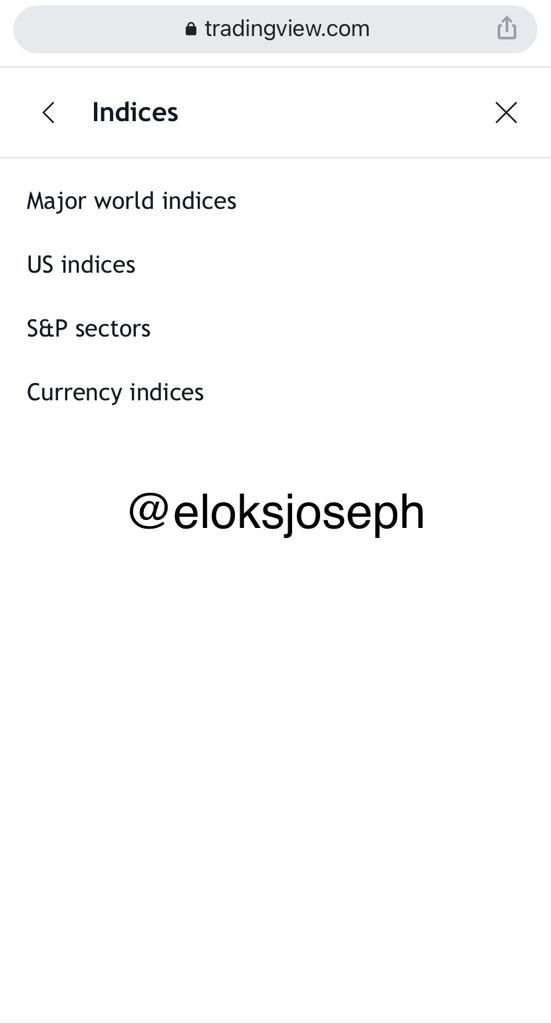
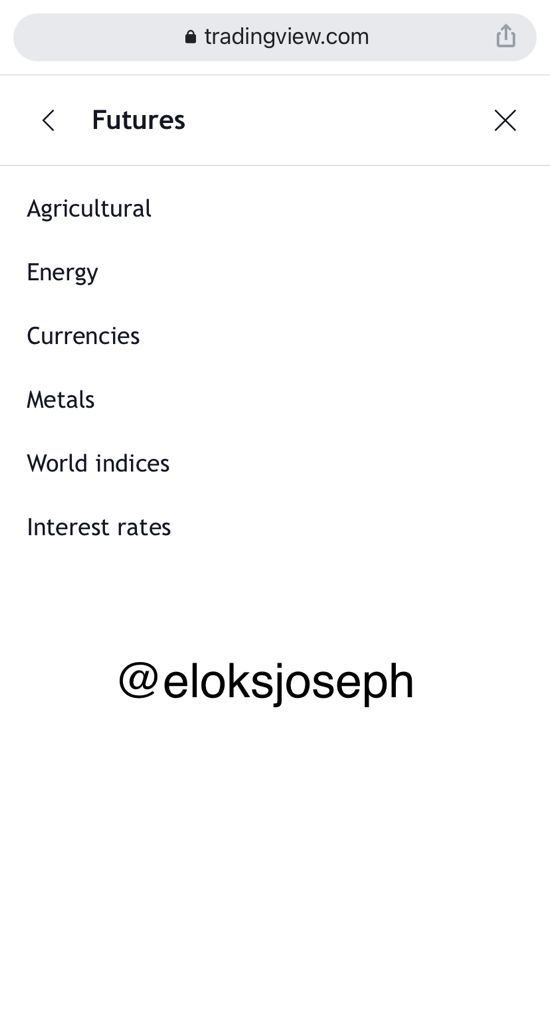
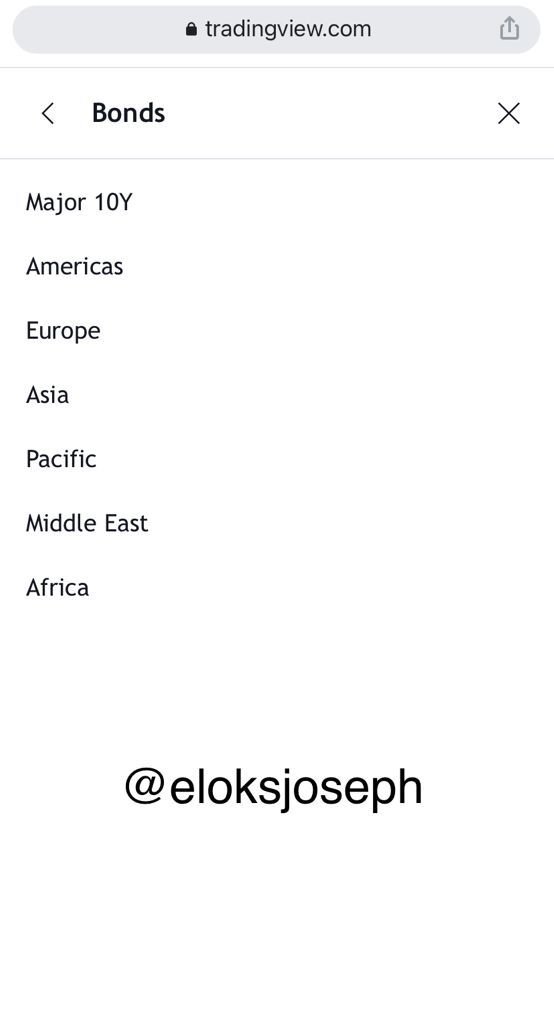
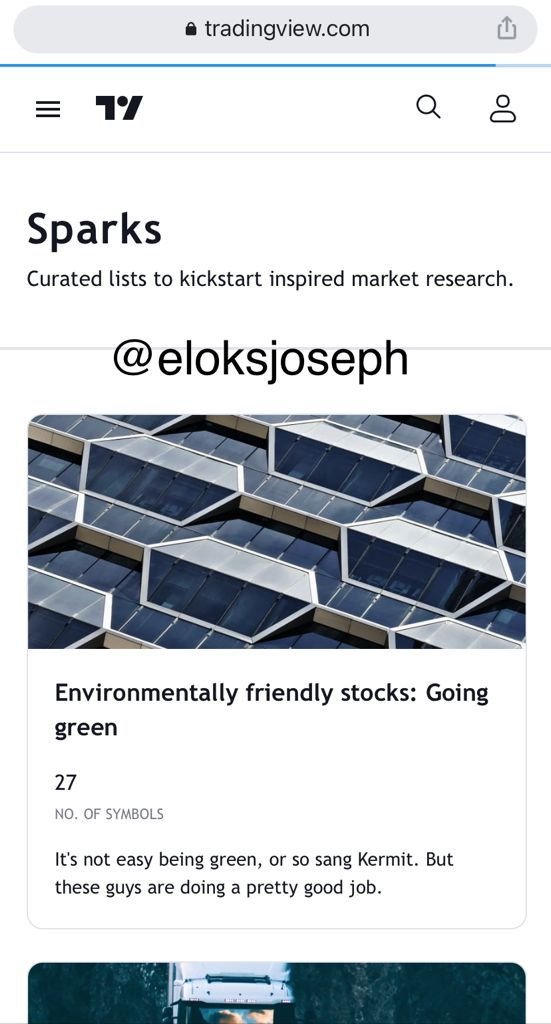
MARKET
Here, the assets that are available on Trading view are seen here. They are further divided into cryptocurrencies,currencies, stocks,indices, futures,bonds, sparks.

SCREENERS
There are 3 types of screeners. Stock screener, forex screener , crypto screeners.

COMMUNITY
This is the community of traders in tradingview. Various traders can communicate on this platform using this feature.

MORE
This is the last of all the features in the trading view platform. Here you can find help on the site, about the platform, etc.

MY FAVORITE FEATURE
Fron all the features above , my favourite is the community. This is because the community feature gives me the opportunity to connect with other traders and we we can learn from each other and share trading ideas.
How to set up a chart in TradingView and use two tools to edit it.(screenshot necessary)
Setting up a chart is an easy task and I'll show how to set up a chart . (I'll be using the mbilr application for this section)
- First of all you have to open a chart. I'll be using the BTC/USDT pair.

- Click in the 3 dots at the bottom right corner and you'll see a menu tab.


- Click on chart settings and you'll see various options like appearance,scales ,status lines ,etc. Let's try to change the chart appearance.

- Click on appearance. You can change the background colour ,the grid lines etc.

- Let's change the background to a dark grey so the chart looks like it's in a night mode. Click ok and see the results.

Now let's move in to how to add tools. I'll be adding an arrow and trend line.
- Unlike on desktops, the options bar is often vertical on the bottom of the chart. Click on tool to access the tool menu.

- In the tool menu, you'll see various options like trend lines , geometric shapes , etc.
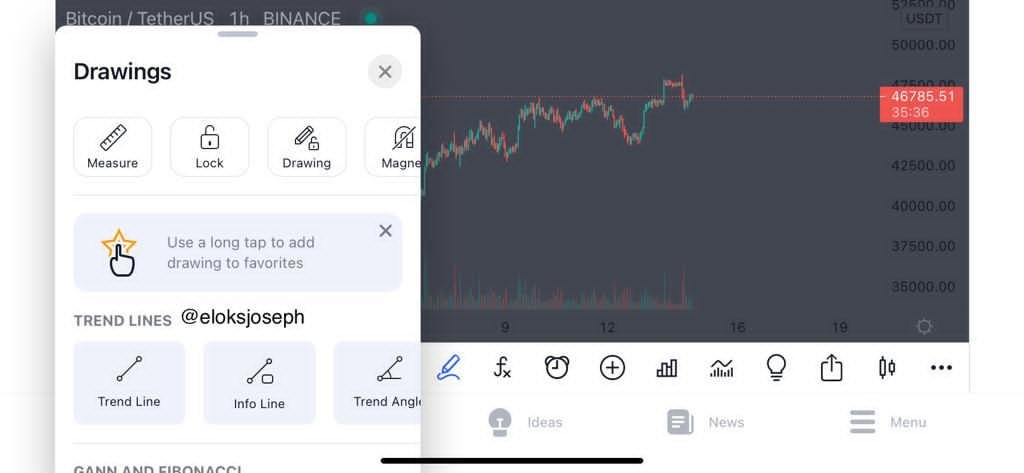
- Scroll along the trend lines section to find " arrow". Click on it and it'll be added. You can choose the pixel size, colour, position,etc. Arrows can be used to signify direction of trend.

- Next I'll be adding an horizontal trend line. This is also found in the trend lines section. The horizontal trend lines can be used to mark out resistance and support levels.

Explain how to add indicator in chart, what is your your favorite indicator and why?
One of the reasons a lot of traders love tradingview is because of the availability of a wide range of indicators.
Adding indicators is a really easy task. Let's see how below;
- Open a Chart, find "Fx" and click on it
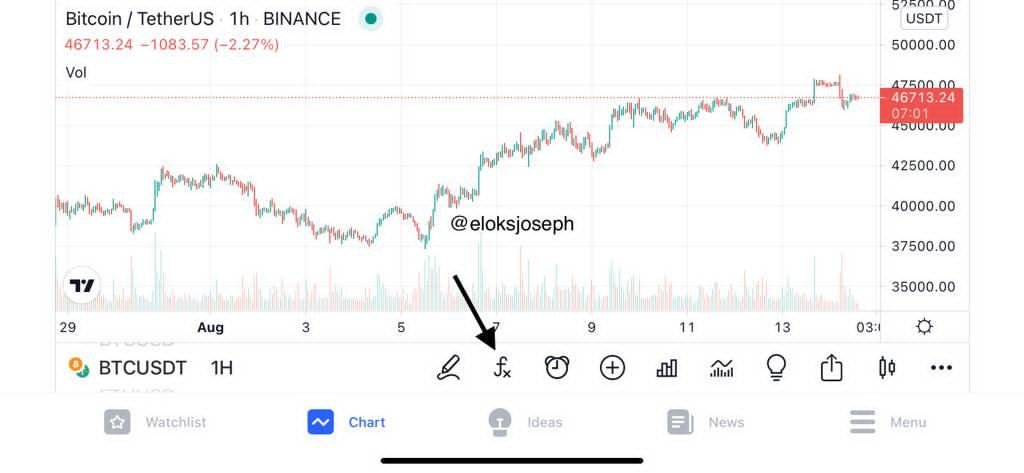
- After clicking , you'll see a wide range of indicators. You also have the option to search.

- I'll be talking about the Bollinger bands indicator as it is my favorite. Let's add it by searching for it .

- Bollinger bands Indicator has been added to the chart.
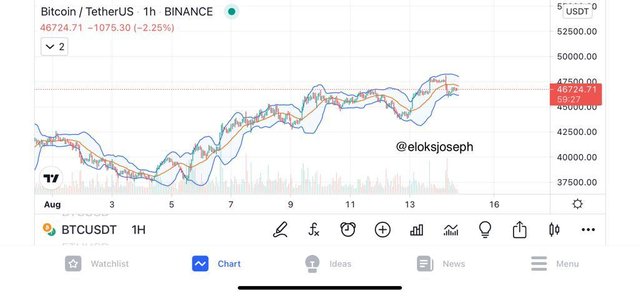

WHY I LIKE THE BOLLINGER BANDS INDICATOR
The Bollinger bands indicator was invented by John Bollinger in the 1980s. The Bollinger bands indicator shows the oversold and overbought positions of the market . It also shows the current volatility of the market.
It consists of 3 bands, the upper band , the lower band and the the moving average as the middle band. It is often used in trending markets.
I like the indicator because even though trending markets are tricky, the bollinger bands indicator shows possible buy and sell entries with the position of the chart in the bands . If the chart is is below the moving average and the best time to buy is often when the market has broken below the lower band. The best time to sell is when the market is above the moving average and breaks above the upper band.
Like every other indicator, it is best combines with indicators for better efficiency. A great indicator to use with the Bollinger bands is the RSI graph. A combination of both often gives better buy and sell entries and exits.
Do you think TradingView is useful in predicting the market for cryptocurrency (trend / price)?
Yes of course. Trading view is very useful in predicting market and it is a great tool used by traders. Traders make use of historic data and current chart patterns to trade. Tradingview shows date of up to 5 years which gives traders a long period of historic data to feed on.
Another important use of tradingview is it's indicators. Indicators are used for technical analysis. These indicators helps in forecasting price of assets and also identifying current trend of the market.
CONCLUSION
Tradingview is a great platform where traders can access charts , talk to other traders and study financial data with ease . Ever since it was launched , a lot of traders have been using it to get appropriate and accurate chart data.
The indicators available on the site and the ability for traders to be able to add more than one indicator per chart is really exceptional . Tradingview unique ability to enable traders chat with each other is also unrivaled as those who are beginners can also learn from the experts in the stream.
Thank you for the lecture professor @yousafharoonkhan.
all images are original screenshots from tradingview.com
Respected first thank you very much for taking interest in SteemitCryptoAcademy
Season 3 | intermediate course class week 7
thank you very much for taking interest in this class
Thank you for your kind review sir