Season 2-Week 8 | Cryptocurrency Trading with Bollinger Bands
INTRODUCTION
Hi guys ,welcome to Season 2 week 8 of steemit crypto academy.Today I read through the lecture given by professor @kouba01 on Bollinger bands. Therefore in this post, I'll be doing the homework task given.Lets get in with it shall we;
Define the Bollinger Bands indicator by explaining its calculation method, how does it work? and what is the best Bollinger Band setup?
BOLLINGER BANDS INDICATOR
The Bollinger bands indicator was created in the 1980s by a financial analyst names John Bollinger. They are used for technical analysis.It shows whether the market has high or low volatility.It also gives information on overbought or oversold conditions.
The Bollinger bands indicator consists of three bands; the upper band,the middle band and the lower band. The middle band is also known as the moving average .This middle band is set on a 20 day moving period and is the called the Simple Moving Average (SMA).The upper and lower bands are then plotted at a standard deviation of this SMA. That said ,the upper and lower bands are often plotted as a double standard deviation of this SMA.That is , 2 times standard deviation.
This would be broadly explained in the next session where we take about how the Bollinger bands are calculated.
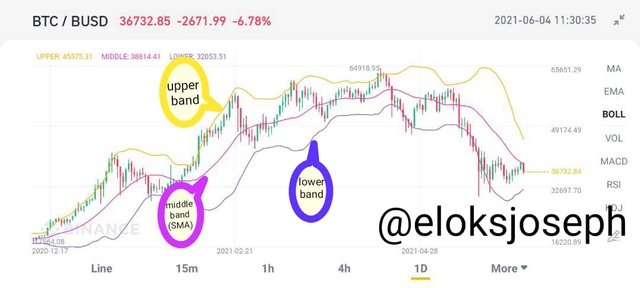
screenshot from my binance exchange mobile app
The Bollinger bands indicator is often found on exchanges and trading websites.
HOW THE BOLLINGER BANDS ARE CALCULATED
There are two important things that the Bollinger bands are dependent on;
- (1) The moving average; this is the average closing price of an asset over a given period of time.
Moving Average (MA) = sum of prices over a given period ÷number of days in the period
The default period is 20 days . Therefore,the default moving average of the moving average is the sum of prices over 20 days divided over 20 days .
- (2) the standard deviation ;this is the difference between the average price and the current price.
Like I said before ,the middle band is the moving average and to calculate the upper band and the lower bands are pretty easy.To get the upper band ,you simply add 2 standard deviation while to get the lower band , you'll deduct 2 standard deviation from the moving average.
Upper band: MA + 2 standard deviation
Lower band: MA - 2 standard deviation
Luckily for us ,the Bollinger bands are automatically calculated on most Exchanges so we don't need to bother so solve for these manually.
THE BEST BOLLINGER BAND SET UP
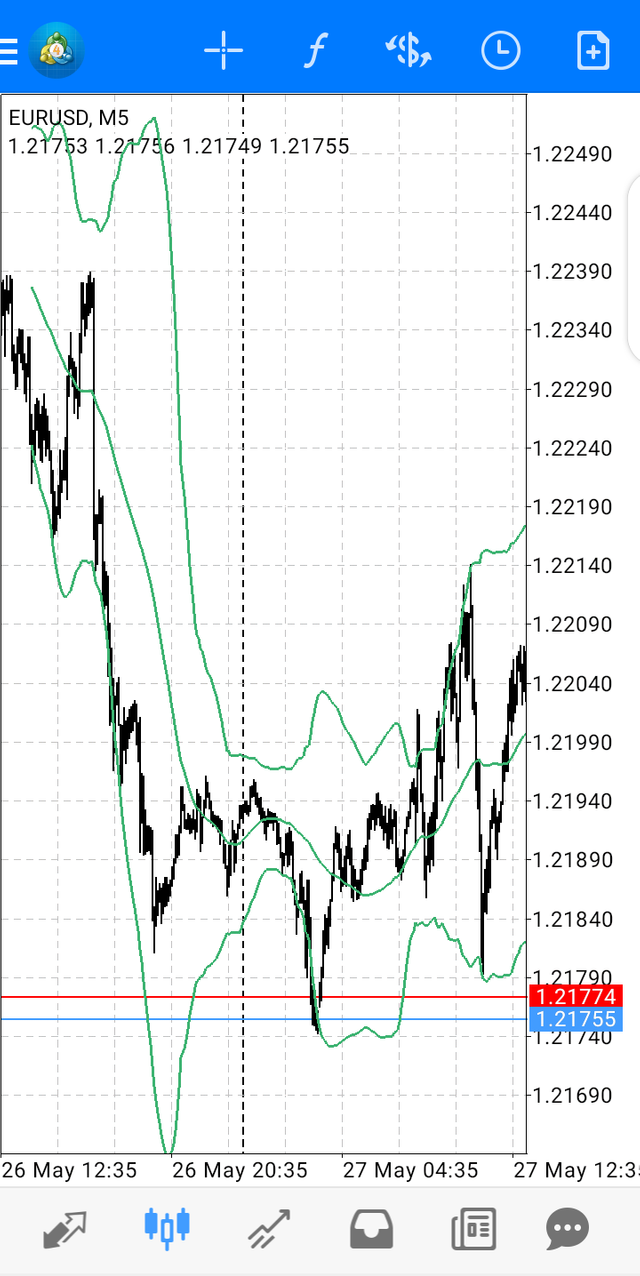
For this part of the task ,I'll be using the meta trader mobile app.
Before I explain the best Bollinger band set up, I'll first show you how to use the Bollinger band indicator on a chart.
This can be done in a few steps;
- Pick out a trade chart.For this ,I'll be using the EURO/USD chart.To get indicators, they're often debited by f or fx.
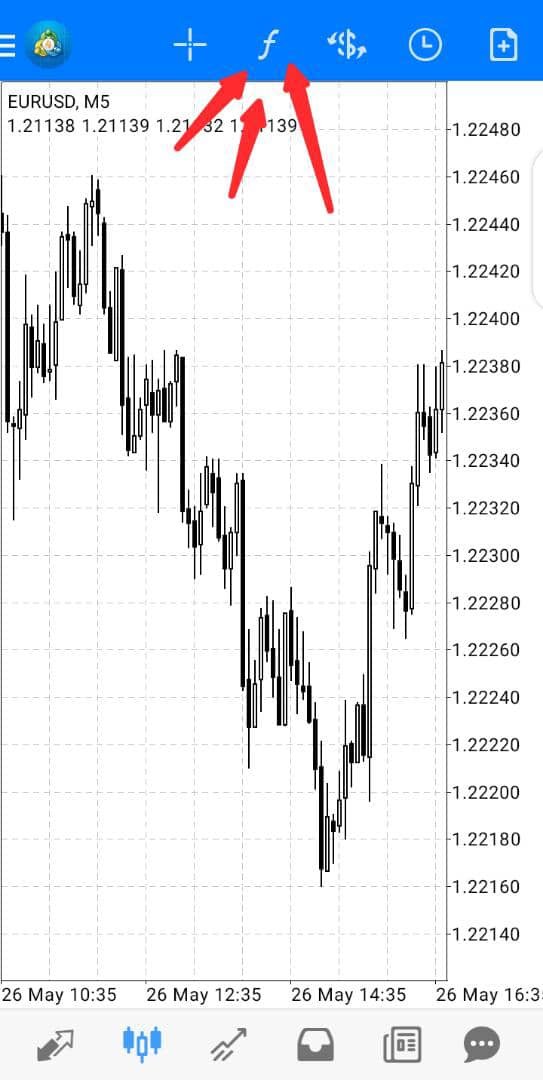
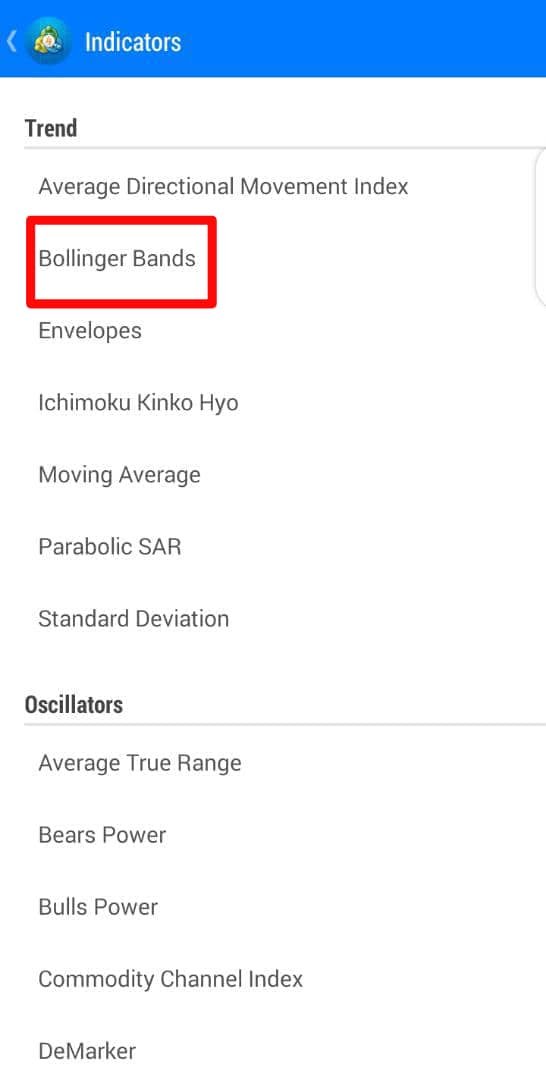
Once you've clicked on the fx or f tab,you'll see a list of indicators.Simply identify the Bollinger bands and then select it.
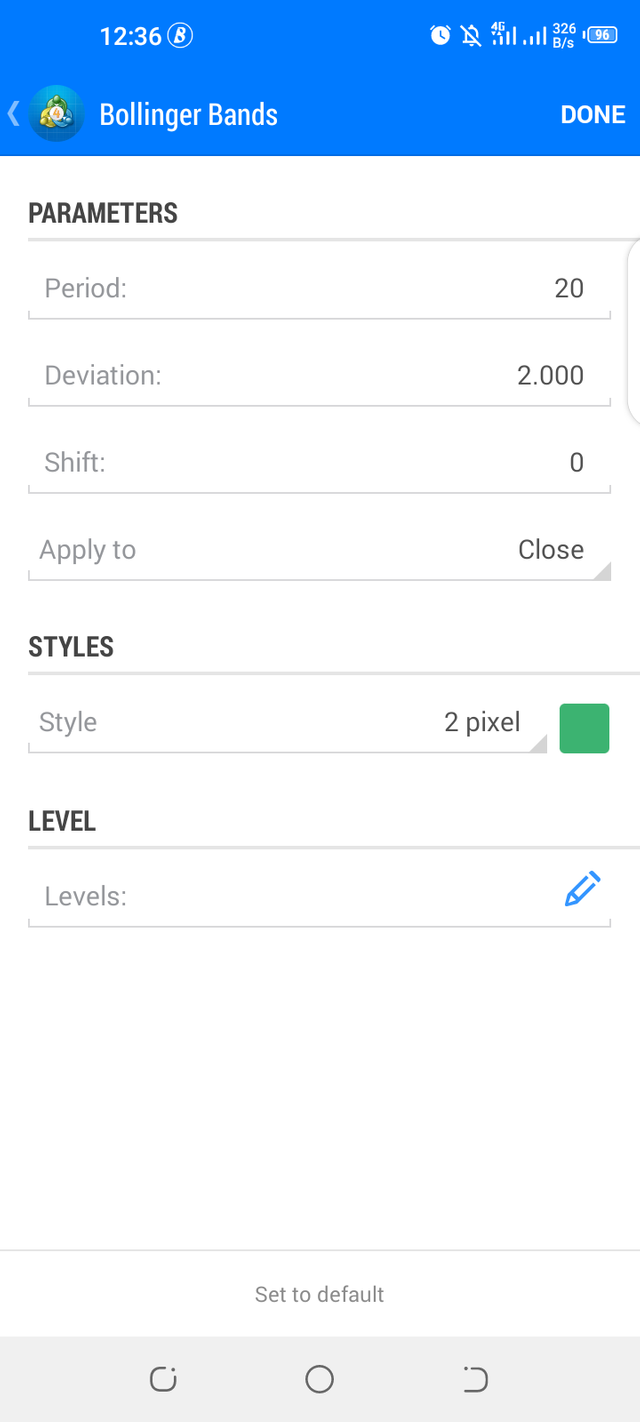
Once you've selected it ,you'll be able to pick the period,the standard deviation and also what you'll apply it to ,that is,the close price,open price,high ,low amongst many others.
Now I'm going to align the bollinger band to the best set up.
- Period = 20 days
- Standard deviation = 2
- Applied to the close price.
Something like this 🔻
After applying these settings ,the Bollinger bands would look like ;
Here you can see the upper band,lower band and the moving average.
Note that this is also the default settling for the Bollinger bands indicator.That said,it can also be configured to a 10 day period in which the standard deviation would be 1.5 and also a 50 day period in which the standard deviation would be 2.5.
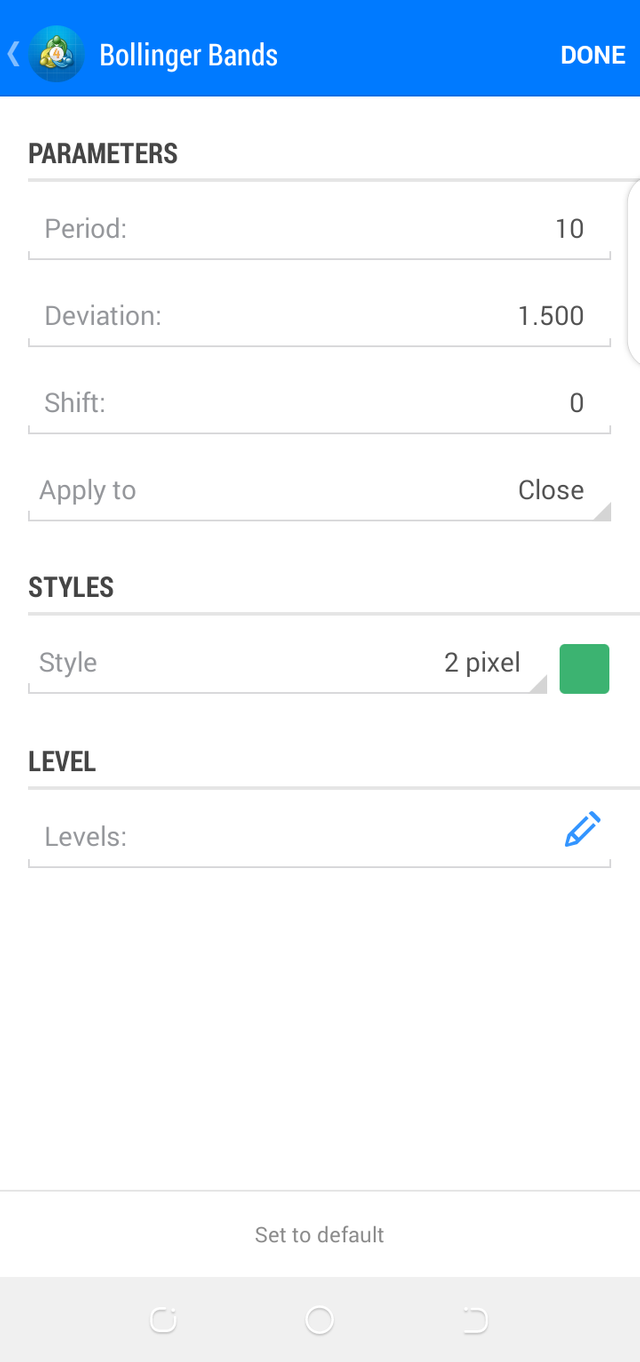
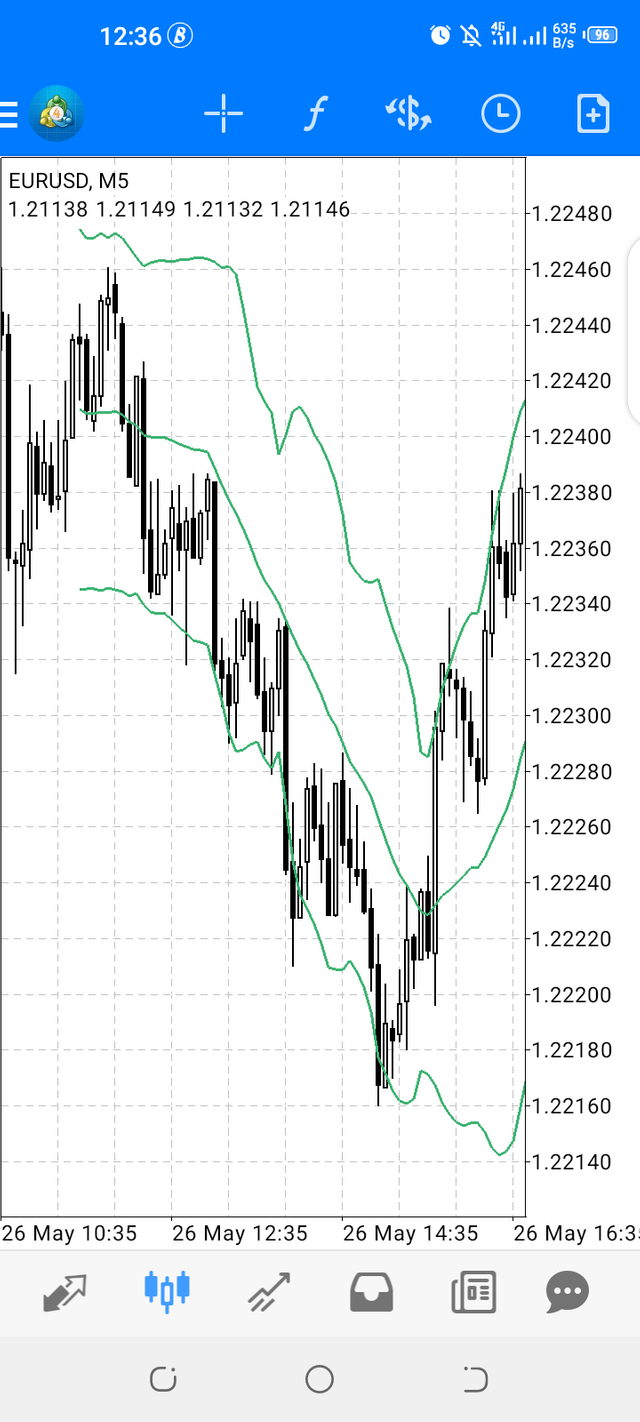
Setting and chart of period 10 days and standard deviation 1.5
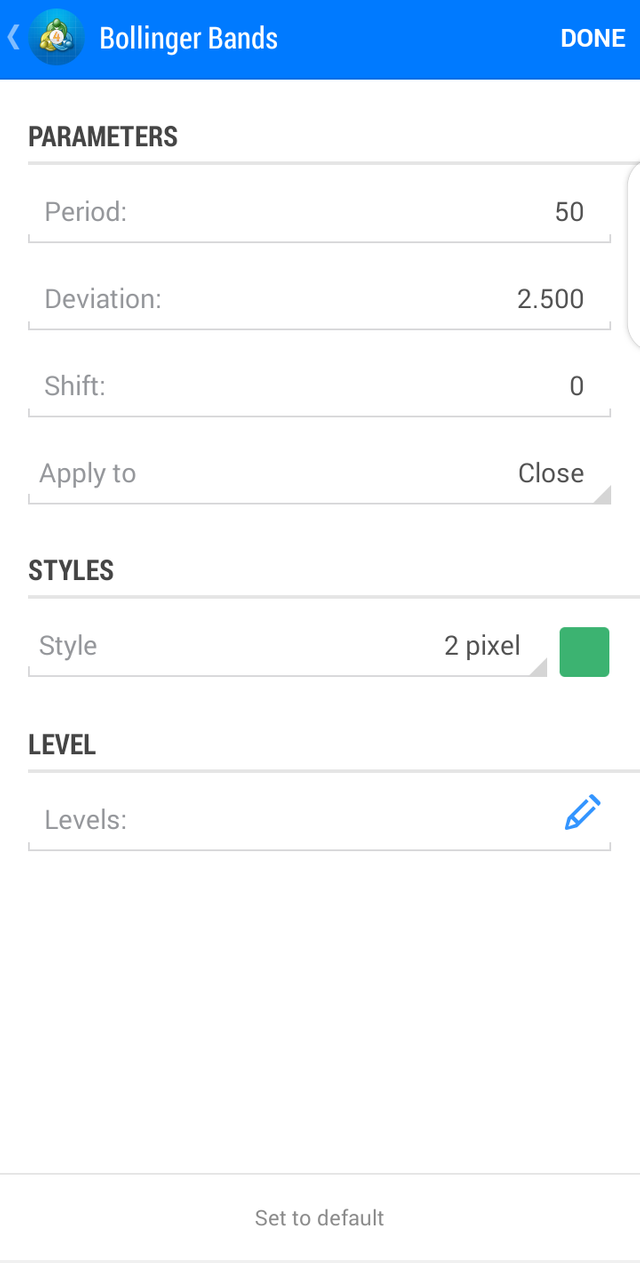
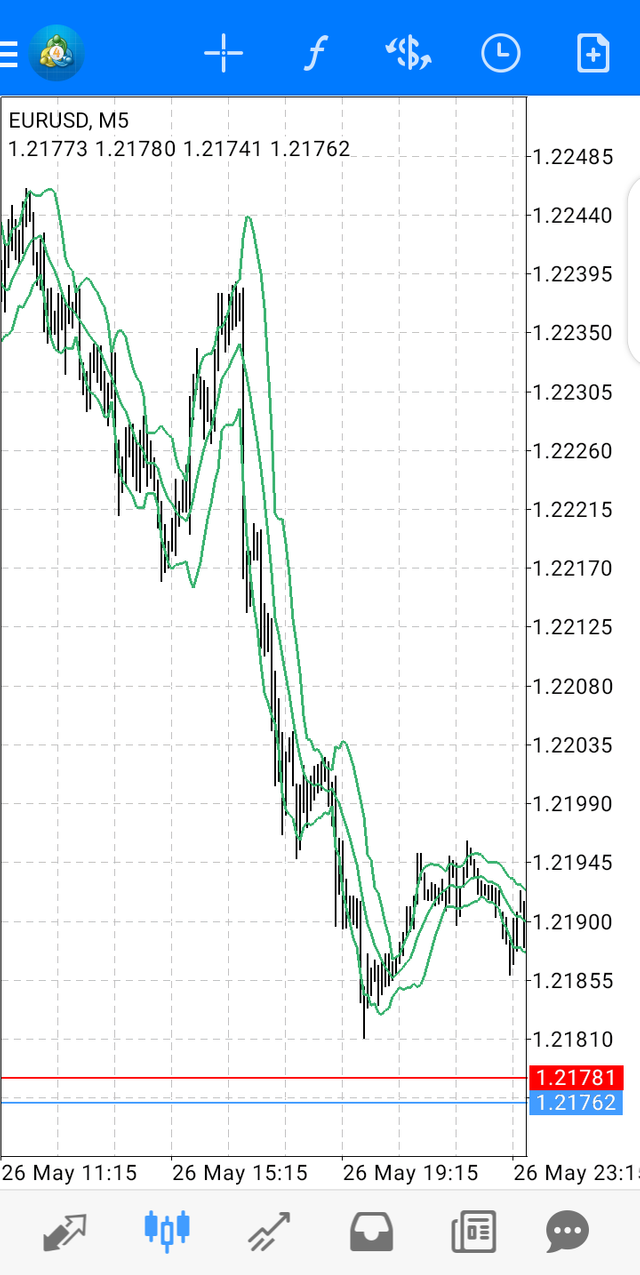
Setting and chart of period 50 days and standard deviation 2.5
In summary the best Bollinger band set up is the default set up with a period of 20 days and standard deviation of 2.
What is a breakout and how do you determine it?
A break out often occurs when there's an increase in the volatility of a market. This might be the price of an asset breaking the support and resistance level, the price of an asset moving above and below the moving average,etc. Using the Bollinger band indicator, increase in volatility causes the bands to expand. A breakout often happens after a squeeze and the candles are seen to be breaking out of the bands.
We can also use resistance and support to check out for break outs.When and asset breaks support or resistance,it often leads to a breakout .This then leads to a volatile market and in a volatile market ,the bands are far apart so as the volatility increases,the bands expand and as the volatility decreases,the bands grow thinner.
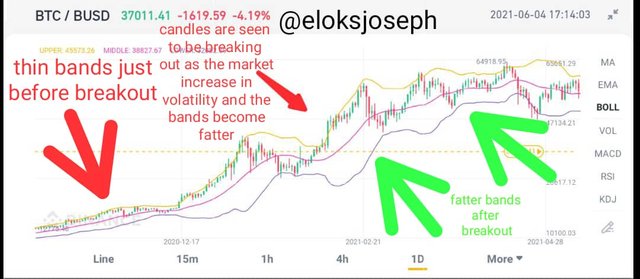
Screenshot taken from my binance exchange mobile app
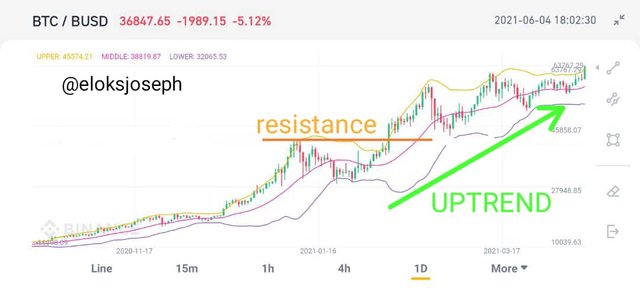
As you can see from the live BTC/BUSD chart above,there was a break out if a couple candlesticks after a period of squeeze.As the volatility of the market increases,the bands expanded. As I said before , a breakout can also happen after the chart has broken resistance or support.The chart below successfully broke resistance which led to an uptrend.
How to use Bollinger bands with a trending market
A trending market is a market going through uptrends and downtrends.A trending market is a volatile market with the Bollinger bands wide apart. Going into a volatile market is really tricky and we need all the help we can get to avoid losses.
Using the Bollinger band indicator,when the price of the asset goes below the moving average or is below the moving average, most times the market is in a buy position.The best time to buy into a market is after the candlestick breaks out below the lower band .This usually isn't the case and is not 100% sure ,so it is best to turn to other indicators to back it up.
Alternatively when an asset is rising and is above the moving average ,it can also be a good time to leave the market. An uptrend is often caused by an overbought market where the asset is scarce and the asset is in high demand.This would lead to an increase in price of the asset.When a market is undergoing uptrend and the candlesticks are out of the upper band,it is also a good time to sell .
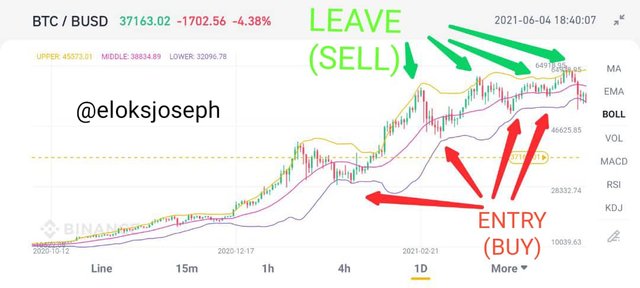
screenshot from my binance exchange mobile app
From the graph above ,you'll notice a volatile market with consistent uptrends and downtrends. When the candle are extremely close to the lower band or go below the lower band ,it is a good time to buy as the market might most likely begin an uptrend. Also ,if the price of an asset goes above the upper band,it is a good time to sell as the market trend might likely go down.
Always remember that the financial market is very risky so it's bet to refer to multiple indicators and also doing research before buying into a market.
What is the best indicator to use with Bollinger Bands to make your trade more meaningful?
Over the course of my research ,I've figured out that it's best to combine 2 indicators that have similar features. One good indicator that has a similar feature with the bollinger bands indicator is the RSI Indicator because it also shows the overbought and oversold positions.
Both indicators also use the average price of the asset to get it's configuration. Combining the overbought and oversold information given by the RSI with the bollinger bands indicator,false signals could be cancelled out.
It is common knowledge that when the RSI is above 70,the market is in an overbought position and when it is below 30, it is in an oversold position. It is also known that in the bollinger band indicator ,the upper band is the overbought region and the lower band is the oversold region.
With this information,we know that for a valid signal, when the RSI is above 70 and the candles have broken out of the upper band of the Bollinger band indicator,it is a good time to sell the assets.Alternatively, when the RSI is below 30 and the candles have broken out of the bollinger bands,it is a great time to get into that market.
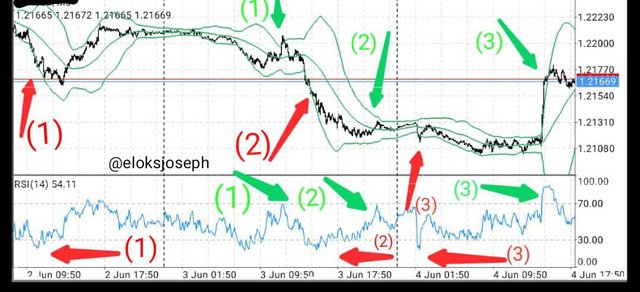
screenshot from metatrader 4 mobile app
From the screenshot above ,I used 2 colours ,red to signify when the market is in oversold position and also when the market is in overbought position I used the green markings.
In the green markings,you can see that when the candles touched the upper band,the RSI was over 70 and when it broke out below the lower band, the RSI was below 30. This shows that those are valid signals.
What timeframe does the Bollinger Bands work best on?And why?
I don't think there's a particular timeframe best suited for the bollinger bands indicator. I believe it actually depends on the type of reader you are. A scalp trader would explore shorter time frames like 15 min, 30 min or 1hr but a swing trader in the other hand would consider a longer time frame like 4hours,1 day or even 1 week.
All in all,the bollinger bands would adjust aromatically to any time frame you set. The volatility of the market and the spread of the market depends on the timeframe set as we can not have the same band set up for a 1 hour and a 1 week graph.
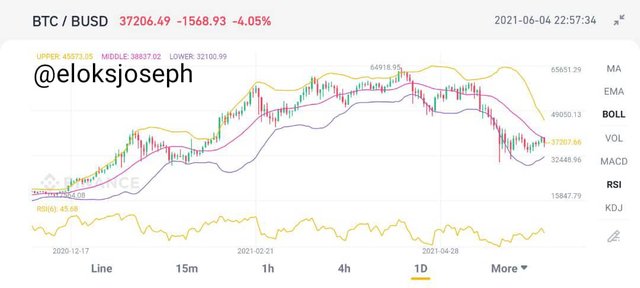
Screenshot taken from my binance exchange mobile app
As you can see from the 1 day timeframe,the bollinger bands are first in a squeeze.The market wasn't volatile,but as it goes on the market became more volatile and began to spread. You can see the market reject the the moving Average several times therefore causing a downtrend and uptrend movement in a initially bullish run before going slightly bearish.
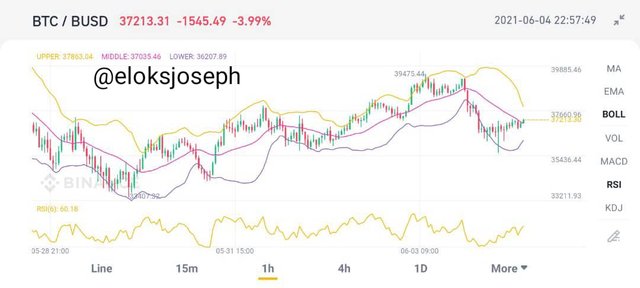
Screenshot taken from my binance exchange mobile app
In this chart ,you can see the market bring volatile from the start and never really undergoing either a bullish or bearish trend. It is would be very bad to enter inside this trade at the moment as the moving average isn't steady do it's best to take more time studying the graph.
Review the chart of any pair and present the various signals giving by the indicator Bollinger Bands
I'll be reviewing the BNB/BUSD pair with the Bollinger bands indicator. When the Bollinger bands are close together or in a squeeze, there's low volatility in the market and often a good time to buy.As soon as 2 or more candles breakout from the bands, there's an increase in volatility in the market and a trend occurs.
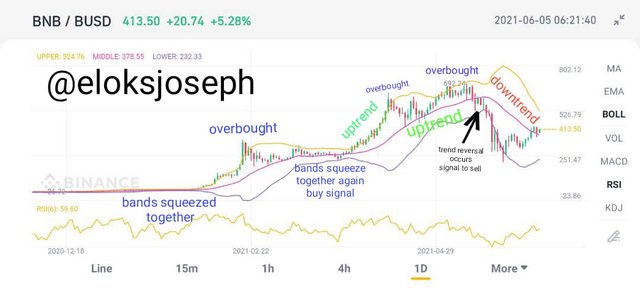
screenshot taken from the binance exchange mobile app
From the screenshot above ,you'll notice that the bollinger bands start at a squeeze.Looking closely, you'll notice about 2-3 candles breakout from the upper band thereby leading to an uptrend.
The price of the asset keeps increasing as the volatility of the market increases and not long after , another breakout of the upper band is noticed, signifying and overbought position.Sons traders would sell their assets and await another buy signal.After the initial overbuy ,you can see the candles moving closer to the moving average and this stabilizes the market and reduces the volatility.
The bands are squeezed together temporarily.
Then again another 2-3 candles are seen to break the upper band and another uptrend movement occurs.There was a long uptrend before a trend reversal occured.
After the 3rd overbuy,the candles didn't stay close to the middle band to lead to a volatile market, instead the candles broke the lower band multiple times signifying a trend reversal. The candles breaking the Lowe band signifies start of a downtrend and a reduction in price. This is a signal to sell the asset.
CONCLUSION
The Bollinger bands indicator is a very good indicator for technical analysis as it often shows the oversold and overbuy positions of a market. It also shows the volatility of a market. Using the average prices of the asset over a period ( default 20 days) it gives traders inside information on when to buy or sell off an asset.
Like other indicators,the Bollinger bands are not 100% efficient and so it is best advisable to combine with other indicators e.g the RSI indicator. Combining both indicators would prove useful in identifying false signals.
Thanks you for the great lecture Professor @kouba01. It was a pleasure going through it. I have really learnt a lot over the course of the lecture and when doing more research for this assignment task
CC : @kouba01
Hello @eloksjoseph,
Thank you for participating in the 8th Week Crypto Course in its second season and for your efforts to complete the suggested tasks, you deserve a 9/10 rating, according to the following scale:
My review :
Excellent work, through which you were able to answer all the questions clearly, although some depth was lacking in the analysis for some points.
Thanks again for your effort, and we look forward to reading your next work.
Sincerely,@kouba01
Thank you for your review professor,I'll put a more in depth analysis next time.