Advanced Technical Analysis Using Fractals - Steemit Crypto Academy - S5W8 - Homework Post for @reddileep
Hello All Steemians !!!
Today I'm going to make my Steemit Crypto Academy Homework task by professor @reddileep that talking about Advanced Technical Analysis Using Fractals. Very interesting lessons. Actually I have very little knowledge about this, but I will try to discuss it to improve my writing skills. On this occasion I will try to discuss it.

Define Fractals in your own Words
In the world of cryptocurrencies, volatile price movement in the market have become the nature of cryptocurrencies that continue to occur over time. This is evidenced by Fractals that occur in the market and can be analyzed on cryptocurrency trading charts. The Fractal shows a repeating pattern which occurs when the trend is bullish or bearish. This is directly related to market psychology which is controlled by traders where supply and demand are one of the factors that affect the market and result in Fractals or repeated patterns.
Technical analysis is one of the important factors that traders must do in carrying out a good trading strategy. Analysis using the Fractal can be relied on by traders in analyzing a bullish or bearish market trend which indicates the beginning of a trend reversal. In this case, the traders is able to predict the market and price movements based on a mindset that shows the comparison and possibility of patterns that have occurred in the past will occur again in the future.
In this case, the Fractal can be analyzed by the trader on the trading chart by looking at at least five or more candles indicating a trend reversal signal. Traders should wait for the fifth candle to close which confirms the trend reversal. Price movements that indicate trend continuation can be used as a reference by traders to make decisions and take the next step to enter the market. This happens because psychology of traders who believe and expects Fractal will give the same reaction as before so push the market towards a bullish or bearish trend.
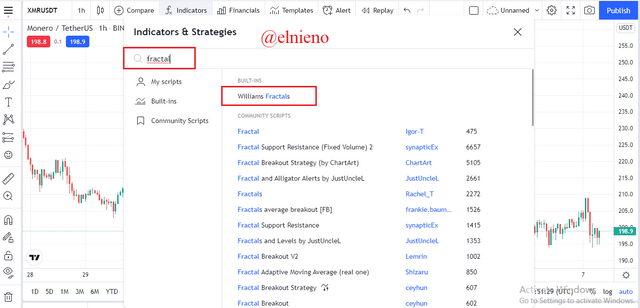
Traders can use a wide variety of available indicators to identify Fractals on trading charts. One of the indicators that is often used is the Williams Fractal indicator which has functions and characteristics that are easily understood by many traders, both beginners and professionals. This can help traders to make trades that can bring profits and eliminate losses.
Explain Major Rules for identifying Fractals
Traders can identify Fractals in the market by analyzing the patterns and candles that form on the chart. In this case, the Fractal must have at least five or more candles that will determine the accuracy of the Fractal. Here, if the number of candles increases, the accuracy of the Fractal will be higher and if the number of candles is less than five, the accuracy of the Fractal will be lower. The identified Fractals must match the predictions and price movements in the market where the bullish Fractal will show a bullish trend and the bearish Fractal will show a bearish trend.
Bullish Fractal
A bullish Fractal can be identified by a trader by analyzing at least five or more candles with two different characteristics. The first characteristic is the candles in the middle of the Fractal showing the lowest lows and the second characteristic is the candles on both the right and left sides of the Fractal showing higher lows. Based on this, the Fractal will signal a trend reversal from bearish to bullish followed by an upward price movement.
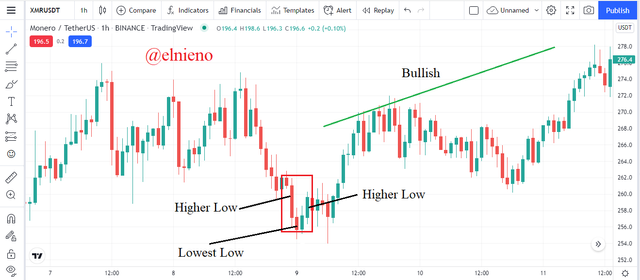
Based on the chart above, the XMR/USDT market shows a Fractal or repeating pattern based on five candles consisting of three bearish candles and two bullish candles forming on the chart. I identify candles in the middle of the Fractal which show the lowest lows and candles on both the right and left sides of the Fractal which show higher lows. The trend reversal from bearish to bullish is confirmed based on bullish Fractals and rising price movements in the market.
Bearish Fractal
A bearish Fractal can be identified by a trader by analyzing at least five or more candles with two different characteristics. The first characteristic is the candles in the middle of the Fractal showing the highest highs and the second characteristic is the candles on both the right and left sides of the Fractal showing lower highs. Based on this, the Fractal will signal a trend reversal from bullish to bearish followed by a downward price movement.
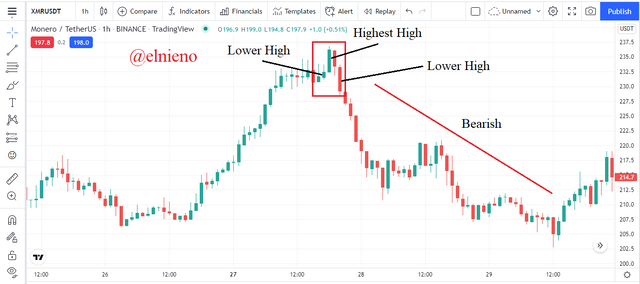
Based on the chart above, the XMR/USDT market shows a Fractal or repeating pattern based on five candles consisting of three bullish candles and two bearish candles forming on the chart. I identify candles in the middle of the Fractal which show the highest highs and candles on both the right and left sides of the Fractal which show lower highs. The trend reversal from bullish to bearish is confirmed based on bearish Fractals and falling price movements in the market.
What are the Different Indicators that we Can Use for Identifying Fractals Easily?
William Fractal
William Fractal is one of the Fractal indicators that traders can rely on to perform technical analysis and execute a good trading strategy. This indicator shows a green arrow pointing up and a red arrow pointing down with different signals or functions. These arrows are key points or identified Fractals on the chart which can be used as a reference by traders for placing entry positions in the market and making profitable trades.
The green arrow pointing up is a sell Fractal signal that can be identified by the trader to place a sell order in the market and the red arrow pointing down is a buy Fractal signal that can be identified by the trader to place a buy order in the market. The use of this indicator can be combined with other indicators such as the Exponential Moving Average (EMA) to filter out false signals and to increase the accuracy of the analysis.
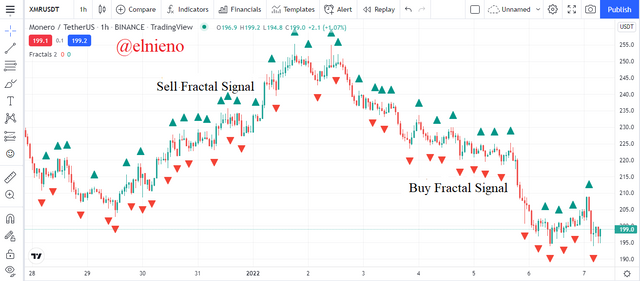
Based on the chart above, the XMR/USDT market is showing Fractals or repeating patterns which the William Fractal indicator can identify on the chart. This indicator shows lots of green arrows pointing up which shows a sell Fractal signal and lots of red arrows pointing down which shows a buy Fractal signal. Traders must place buy or sell orders at the right time to make trades that maximize profit and minimize losses.
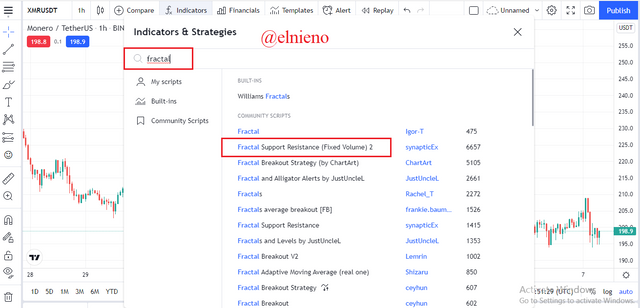
Fractal Support and Resistance
Fractal Support and Resistance is one of the Fractal indicators that traders can rely on to perform technical analysis and execute a good trading strategy. This indicator shows support and resistance levels on the chart that create higher lows, higher highs, lower highs and lower lows based on price movements within a certain period. This can be used as a reference by traders to identify and predict price movements that will continue direction or reverse direction.
The support and resistance levels are the points at which the traders must make the next trading decision. When the price movement reaches the resistance level and breaks through the green line then this is a signal for traders to place a buy or sell entry in the market and when the price movement reaches the support level and breaks through the red line then this is a signal for traders to place a buy or sell exit in the market.
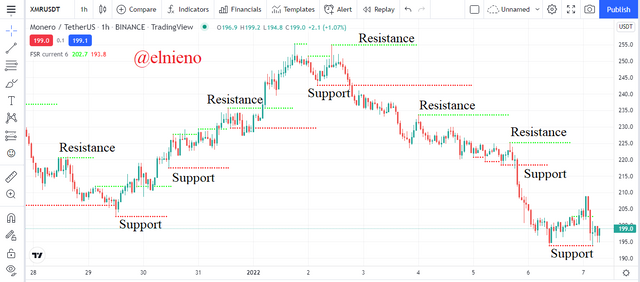
Based on the chart above, the XMR/USDT market is showing Fractals or repeating patterns which the Fractal Support and Resistance indicator can identify on the chart. This indicator shows the resistance level based on price movement which signals the trader to place an entry position in the market and the support level based on the price movement which signals the trader to place an exit position in the market.
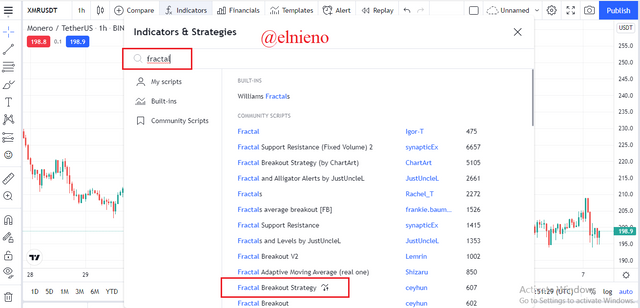
Fractal Breakout Strategy
Fractal Breakout Strategy is one of the Fractal indicators that traders can rely on to perform technical analysis and execute a good trading strategy. This indicator shows the upper and lower lines that move based on the price movement and follow market trends. This indicator can be used as a reference by traders to identify breakout points in the market after price movements move up or down and break through one of these lines.
Upward price movement that breaks through the upper line is a signal for traders to place long positions after breakout and indicates the market is bullish. A downward price movement that breaks through the lower line is a signal for traders to place a short position after breakout and indicates the market is bearish. These lines also act as support and resistance levels that the trader can identify in executing a trade.
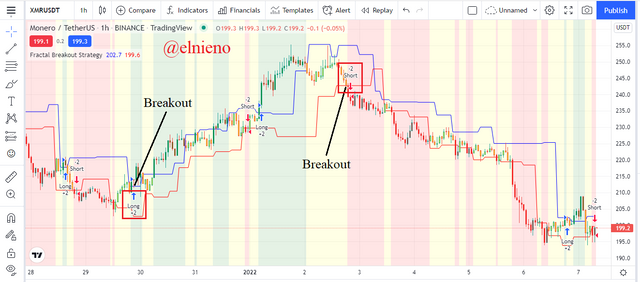
Based on the chart above, the XMR/USDT market is showing Fractals or repeating patterns which the Fractal Breakout Strategy indicator can identify on the chart. This indicator shows the breakout when the price movement breaks the upper line which is a signal to place a long position in the market and the breakout when the price movement breaks the lower line which is a signal to place a short position in the market.
Graphically Explore Fractals Through Charts
Here I will identify Fractals on the chart without using special indicators as before. I will analyze Fractals by looking at the patterns that formed on the charts in the past and compare them with the patterns that formed on the charts in the current time to see the similarities. This helps the trader to identify the bullish or bearish Fractal by using the Bar Pattern tool to copy and compare the chart pattern.
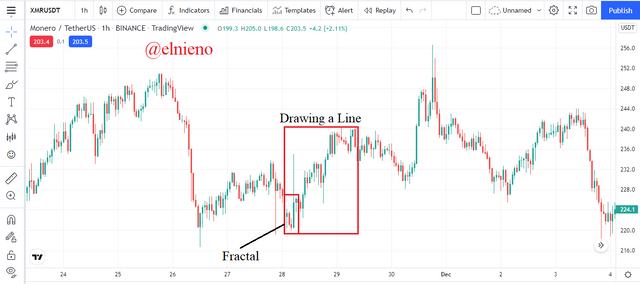
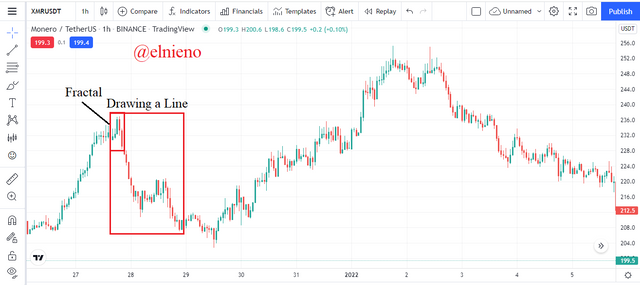
Based on the chart above, I identify a bullish Fractal by analyzing at least five or more candlesticks where the candle in the middle of the Fractal shows the lowest lows and the candles on the right and left of the Fractal indicate higher lows. And I identify a bearish Fractal by analyzing at least five or more candlesticks where the candle in the middle of the Fractal shows the highest highs and the candles on the right and left of the Fractal indicate lower highs.
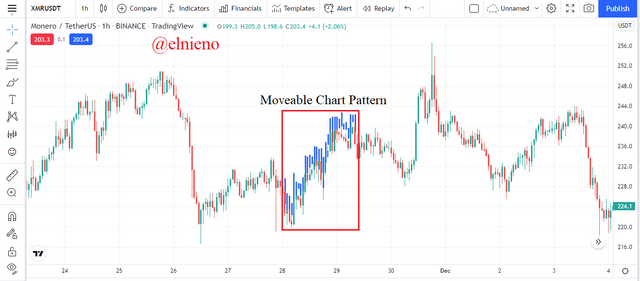
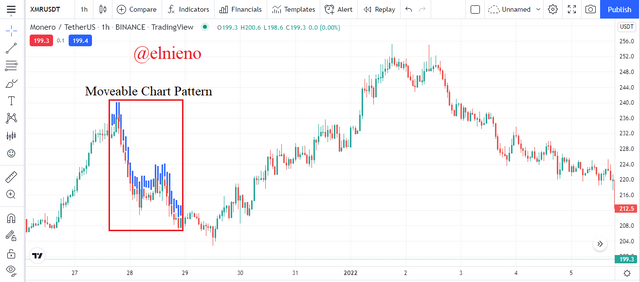
Based on the chart above, I use the Bar Pattern tool to identify Fractals in chart patterns that have formed in the past and compare them with chart patterns that form in the present. Here I draw a line from left to right. This tool will generate a chart pattern according to the line I draw. The chart patterns that I identified in the past can be copied to the chart patterns that I will identify in the present to see the similarities.
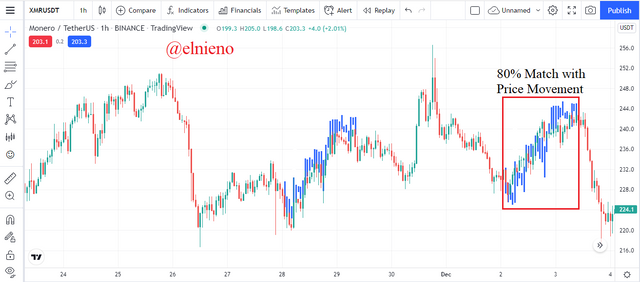
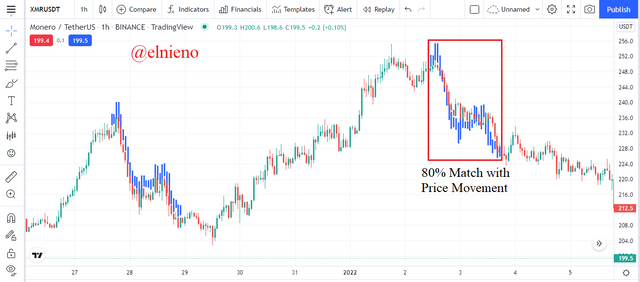
Based on the chart above, the chart patterns that I identified in the past have almost 80% similarity to the chart patterns that I identified in the present. This proves that Fractals can be identified on charts that show repeating patterns based on price movements and changing market trends over time. This will help traders to analyze market trends and predict price movements in carrying out good and profitable trading strategies.
Do a better Technical Analysis identifying Fractals and make a real purchase of a coin at a suitable entry point. Then sell that purchased coin before the next resistance line. Here you can use any other suitable indicator to find the correct entry point in addition to the fractal
Here I will identify Fractals and analyze the SOL/USDT market using a combination of William Fractal and Exponential Moving Average (EMA) indicators on a 5m timeframe. I will use the Upbit exchange to buy and sell at the appropriate entry and exit points.
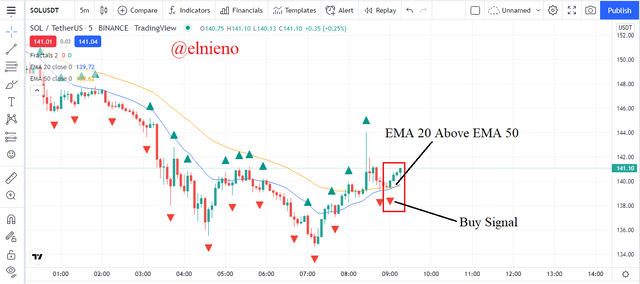
Based on the chart above, the SOL/USDT market is showing a Fractal where I can identify a red arrow pointing down which is a buy Fractal signal from the William Fractal indicator. I also analyze the 20 EMA line which is above the 50 EMA line which is a signal to place a buy entry in the market. The SOL/USDT market shows an upward price movement after the market experienced a bearish trend. I predict the market will experience a strong bullish trend based on the upward price movement supported by buy signals indicated by the William Fractal and EMA indicators.
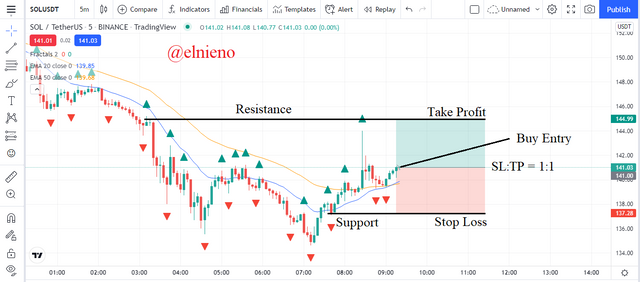
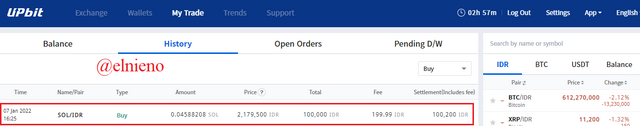
Based on the chart above, I placed a buy entry on the bullish candle at $141. I set the stop loss level below the 50 EMA line according to the support level at $137.28 and the take profit level according to the resistance level at $144.99 in a 1:1 ratio. I placed a buy order on the Upbit exchange with the following transaction details:
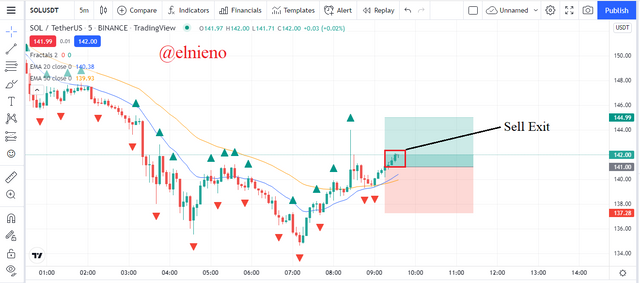
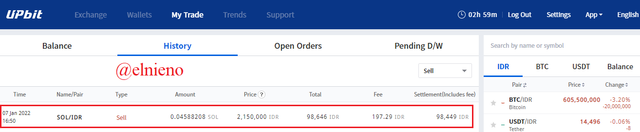
After a while, the SOL/USDT market continues to show price increases and a bullish trend. The rising price movement leads to the take profit level that I have set earlier. Here I place a sell exit on a bullish candle before the next resistance level. This proves that the Fractal shown by the combination of William Fractal and EMA indicators is correct and profitable because the price movements and market of SOL/USDT move according to predictions and analysis results. The chart and transaction details are as follows:
Conclusion
In the world of cryptocurrencies, technical analysis and trading strategies are the main factors that traders need before executing a trade. Technical analysis using Fractals can be used and relied on by traders to make successful trades. Fractals are recurring patterns that occur in the cryptocurrency market due to volatility where this pattern can be identified directly based on the candles that form on the chart or using various Fractal indicators. Fractals indicate a market that will experience a trend reversal so that traders can place entry positions at the right time to maximize profits and minimize losses from executed trades.