Crypto Academy / Season 3 / Week 6 - Homework Post for [@asaj] …Vortex Indicator Strategy
Today's lesson covers a very important topic "Vortex Indicator Strategy". Thank you Professor @asaj for letting us know about Vortex indicator through this lesson. I learned many unknown things about Vortex indicator. I hope the lesson will be helpful for everyone.

1- In your own words explain the vortex indicator and how it is calculated
Vortex indicator
Vortex indicator is an indicator consisting of two lines. These two lines are an uptrend and a downtrend. These two lines are expressed in two ways, uptrend line (VI +) and downtrend line (VI-). Vortex indicator is used to confirm current trends and measure spot trend reversals.
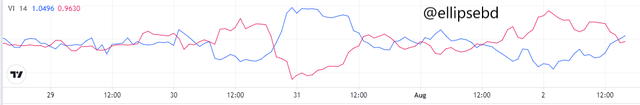
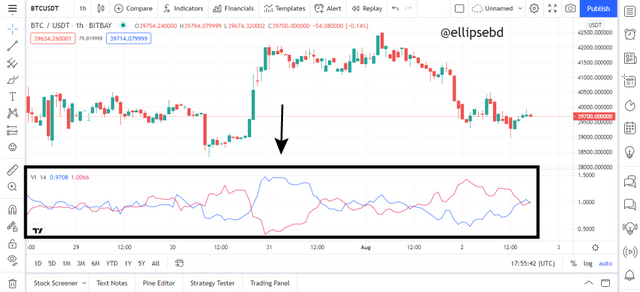
Above we can see Fig-1. This is a screenshot taken from the tradingview. There are two types of lines, blue and red. Indicates blue line uptrend and red line downtrend. If desired, the color of the two can be changed. With the blue line, we will understand the positive price movement (VI +) and with the red line, we will understand the negative price movement (VI-).
Calculation of Vortex indicator
The calculation in Vortex indicator is done in several steps. They are described below:
1- First you have to do uptrend and downtrend calculation. Uptrend movement (VI +) is obtained by subtracting the current high from the previous low. To calculate downtrend movement (VI-) again, you have to minus the previous high from the current low. Thus uptrend and dowwntrend calculation is done.
2- Parameter length
- Sum the last 28 period’s true range, VM28+ and VM28-
- Sum of the last 28 periods’ true range = SUM TR28
- Sum of the last 28 periods’ VM28+ = SUM VM28+
- Sum of the last 28 periods’ VM28- = SUM VM28−
3- It is recommended to do the calculation with 14-28 periods in the Vortex indicator. When calculating with 28 Periods, what will happen if we find out two types of trends are:
VM28 + = 28 period sum of VM+
VM28- = 28 period sum of VM-
4- The true range is found by minus current high to current low minus, then again minus the previous close from current high as well as current low.
There is no indicator that shows perfect results. So to do the calculation well in Vertex indicator, you have to increase and decrease the length of the period. Working with period length 14-28 is expected to get good results.
2- Is the vortex indicator reliable? Explain
The question of whether the vortex indicator is reliable cannot be answered in one word. Because how reliable the indicator is will depend a lot on its use. The Vortex indicator has two lines with which the buy and sell signal can be extracted very well.
But if you want to get good results from the Vortex indicator, it is recommended to work with 14-28 period length. Here is the blue and red line. If the blue line is above the red line, you have to assume that the market is in the uptrend, then when the buy signal is above the red line, then you have to understand that the market is in the downtrend, so it is the sell signal.
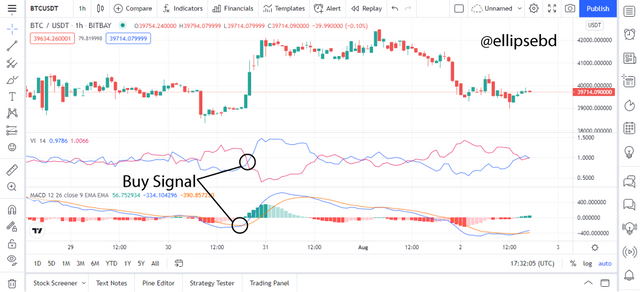
To make the Vortex indicator more reliable, the MACD indicator has been used with it. In Fig-2 we can see in the screenshot above. Here Vortex indicator gave a strong buy signal. The MACD indicator is used to confirm it and the signal is considered as confirmed.
So finally we can say that the Vortex indicator is reliable but it can be used with the MACD indicator to get better results.
3- How is the vortex indicator added to a chart and what are the recommended parameters? (Screenshot required)
Addition of the vortex indicator to a crypto chart
Adding a Vortex indicator to a chart is very easy. Below I will show you step by step how can we add a Vortex indicator to a chart:
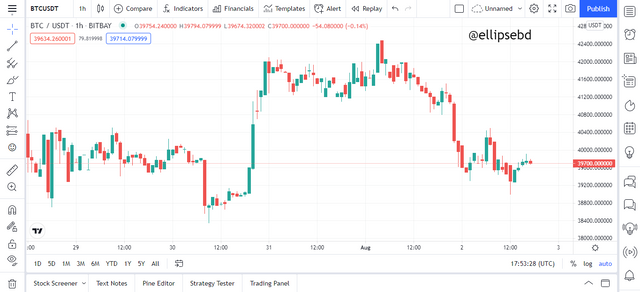
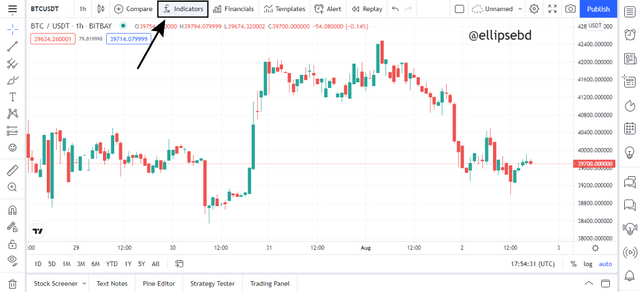
- First, go to https://www.tradingview.com/ then open the chart. I will show the Vortex indicator in BTC/USDT chart.
- In the screenshot, you see Indicators as marked, click there.
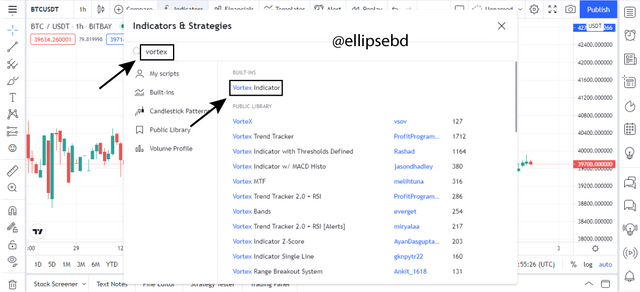
- You will get this search box type Vortex there, then click Vortex Indicator.
- In the screenshot black marked box is the Vortex indicator in BTC/USDT chart. We successfully added the Vortex indicator to a chart.
By following these steps we can easily add Vortex indicator to a chart.
Recommended parameters of Vortex indicator
Welles Wilder's works suggest 14 periods of time frame. Which may be 14 minutes, 14 hours, 14 days, or 14 months. But longer time frame gives us more accurate results. That's why some traders suggest 28 periods time frame.
Trading techniques become one type at a time. So different parameters need to be used at different times. Usually, the signal can be extracted fastly with 7 periods length parameter. But sometimes it may give a false signal, so you have to confirm with a large length period, in this case, the professor has recommended 30 periods, which seemed acceptable to me.
4- Explain in your own words the concept of vortex indicator divergence with examples. (Screenshot required)
Divergence of Vortex indicator with examples
There are two types of divergence in the Vortex indicator. Which are bullish and bearish divergence. Below I will explain both of them with examples.
Bullish divergence
Bullish divergence occurs when the blue trendline (positive) is below the red trendline (negative) and the market is assumed to be in bullish condition. In this case, it gives a buy signal.
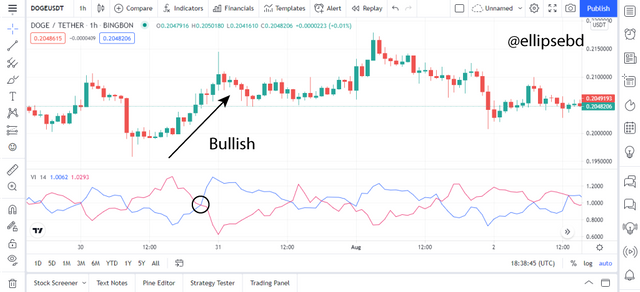
In the above screenshot, we can see a bullish divergence in DOGE / USDT pair. Here the blue trendline is above the red trendline after crossing and we can see the bullish market in the candlesticks pattern above.
Bearish divergence
Bearish divergence occurs when the red trendline (negative) is below the blue trendline (positive) and the market is assumed to be in bearish condition. In this case it gives a sell signal.
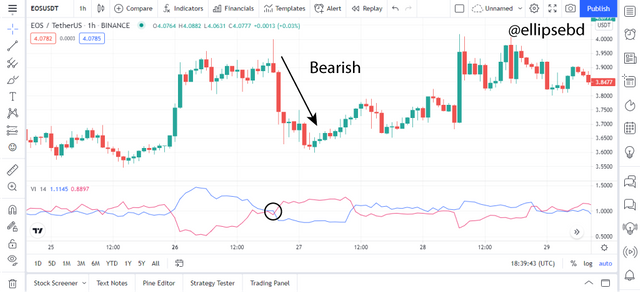
In the above screenshot, we can see a bullish divergence in EOS / USDT pair. Here the red trendline is above the blue trendline after crossing and we can see the bearish market in the candlesticks pattern above.
5- Use the signals of VI to buy and sell any two cryptocurrencies. (Screenshot required)
It has been suggested to choose two cryptocurrencies to show buy and sell signals using the Vortex indicator. Here I have chosen two cryptocurrencies EOS and HNT. Below I have shown buy and sell signal screenshots on these two cryptocurrencies:
1- EOS
In the screenshot below, I have tried to show two buy and sell signals in EOS / USDT pair. Here we can see that the market is in bullish condition when the blue trendline (positive) crosses the red trendline (negative) and stays above the red trendline (negative). This is a buy signal, which I showed with a circle.
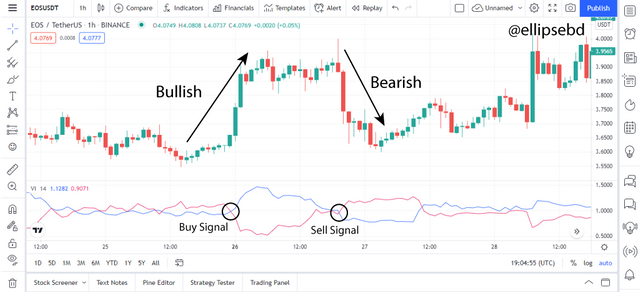
Again a sell signal has been created when the red trendline (negative) crosses the blue trendline (positive) and is located above the blue trendline (positive) then the market is in bearish condition. This is a sell signal, which I showed in a circle.
2- HNT
In the screenshot below, I have tried to show two buy and sell signals in HNT / USDT pair. Here we can see that the market is in bullish condition when the blue trendline (positive) crosses the red trendline (negative) and stays above the red trendline (negative). This is a buy signal, which I showed with a circle.
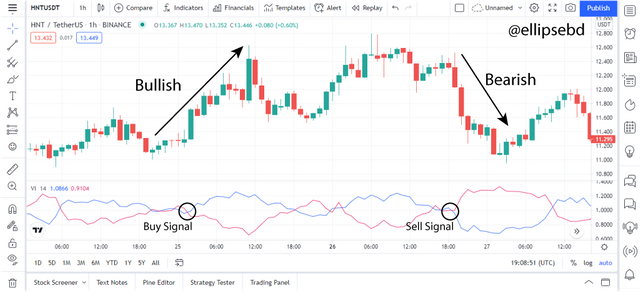
Again a sell signal has been created when the red trendline (negative) crosses the blue trendline (positive) and is located above the blue trendline (positive) then the market is in bearish condition. This is a sell signal, which I showed in a circle.
Conclusion
I learned a lot of new things from today's lecture about the Vortex indicator. I have learned how to do Vortex indicator calculation and I have also learned how to add Vortex indicator in the chart from the lesson. By doing homework tasks, I have researched online and got a lot of information about the Vortex indicator.