Crypto Academy Week 15 - Homework Post for [@yohan2on] by @elity-sitio. The Swing trading style
Introduction to Swing trading
Just like the name implies, Swing trading is the process of trading the swing to make profitable returns. Unlike day trading, swing trading isn't time-specific, the target could be reached in minutes, hours, days, weeks, or months. The main purpose of swing trading is to meet the exit target and not time-specific.
Unlike day trading or scalping, Swing trading often comes with a large profit and although the trader needs to be patient, it is always accompanied by good profit if the trade goes right.
Trading has to do with analyzing the market and making good entries and exits. In this post, I will be analyzing the BTC/USDT market
BTC/USDT Trading Pair
I will be trading the BTC/USDT trading pair. Reasons for my choice are liquidity, volatility, dominance in the crypto market, and a broader time frame to study the market.
Trading Plan
- Multiple Time-frame Analysis
- Trendline, Support and Resistance
- Pattern Recognition
- Indicator
- Entry Point, Exit point, and Stop-Loss
Multiple Time-frame Analysis
To analyze the BTC/USDT trading pair as a swing trader, it is advisable to use multiple time-frame for analysis. I will be using the weekly, 1-day, and 4 hours trading time frame. The 4 hours time frame is the most used by swing traders and I will be using it to check for patterns in the chart.
Trendline, Support, and Resistance
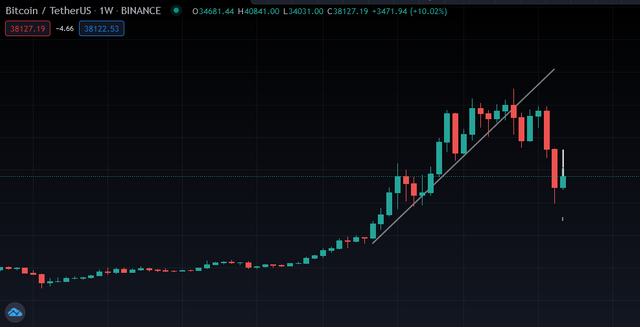
To look out for trendlines in the chart, I will be using the weekly trade chart. It will help look into a longer historical period.
Pattern Recognition
After drawing the trendline, it is visible that the trend was previously an uptrend but the market broke the trend to head toward a downtrend.
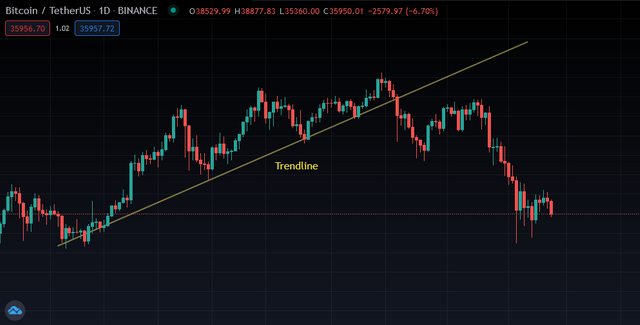
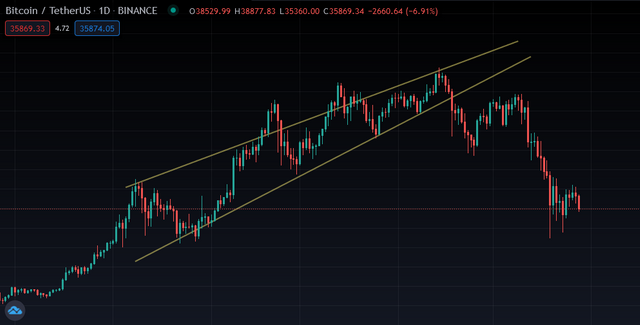
On the daily time frame trading chart, finding supports and resistance would not be difficult as well as creating a clearer trend. After checking for supports and resistance on the chart, a rising wedge was found which proves the next price
action.
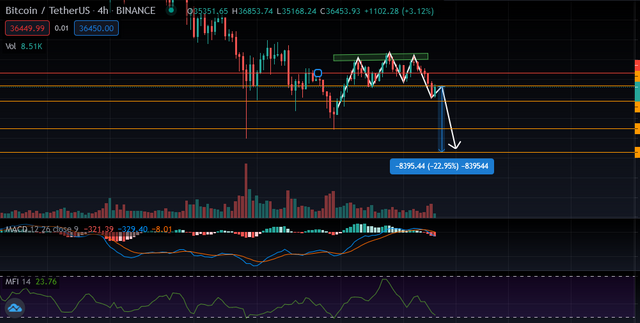
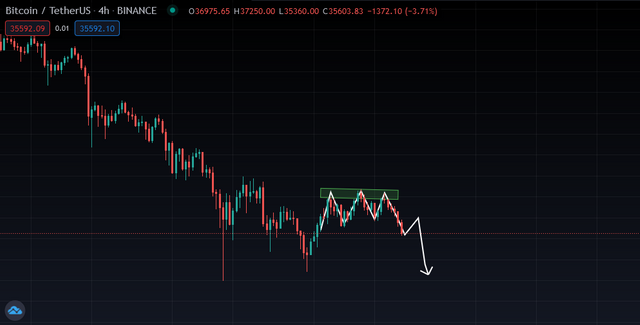
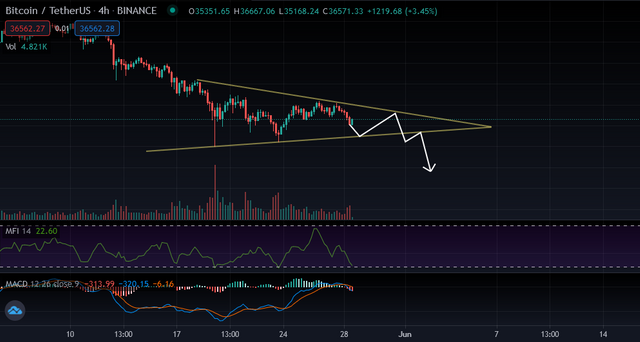
On the 4 hours trading chart, I will be able to see more detailed price movements. In the four hours chart, a triple top
was confirmed which predicts that the next move might be a downward move.
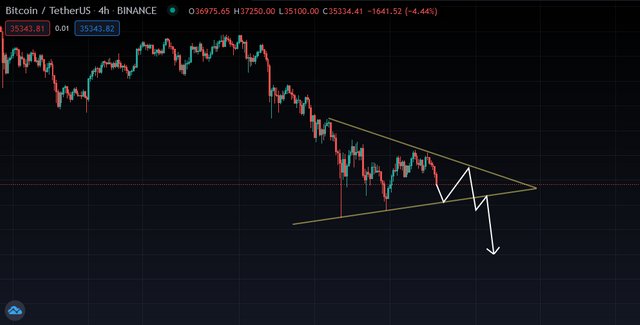
From a larger view, there is a symmetrical triangle that is used to mark a pause before continuing a trend.
Indicator
Several indicators can be used while trading ranging from using Volume, Relative strength index, MACD, EMA, MA, Bollinger band, and so on.
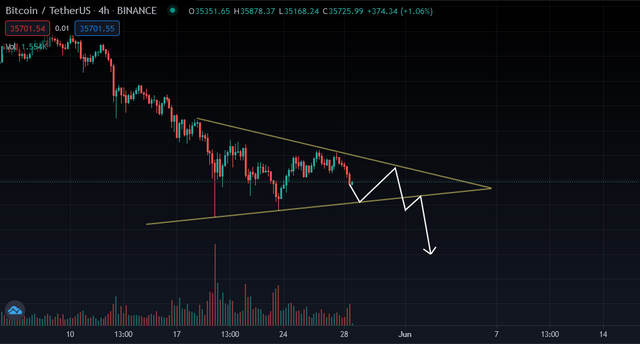
Volume: The volume of the selling is very high, meaning there are more people willing to sell than buy. The sellers are dominating the market currently.
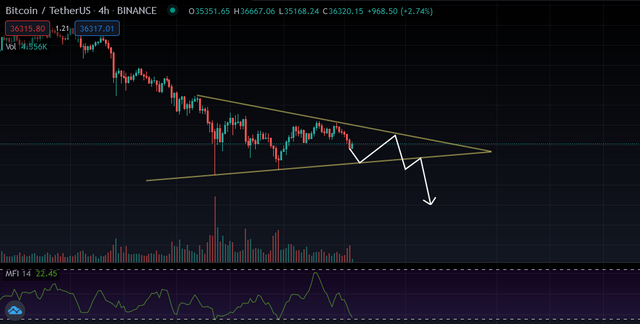
Money Flow Index: This is one indicator that a lot of people do not use but it is very important. MFI refers to the rate of inflow of money into the market. It is used to determine the pressure of buying and selling in the market which is between the number 0 - 100. an increase in MFI shows an increase in the buying dominance in the market. Currently, the MFI is at 22.45 showing that there is more selling pressure but there might be a rise soon.
MACD: The MACD is about to cross below the signal line which shows that the market is in a selling position and once it over-crossed, it proves a downtrend.
Trade management
I will be entering the trade at $36680.20 and from my analysis, the price movement should be down. I Will take my first take profit at the lower highs of $34684.37 and the next TP will be at $31222.52 and the final TP will be at $28221. Stop loss will be at $38278.
Conclusion
The market is unpredictable but then with swing trading, there are broad possibilities. It is very important to always set stop loss as well as have a target. be very careful not to allow greed or fear to consume you, Emotion is the first enemy of a trader. If the market is against you, it is advisable to stop loss. As a trader, there are going to be several trades to be part of but your capital is your capital and when you lose it, the market owes you no money. Do not forget that the market does not print money, your profit is someone elses loss and your loss is someone else's gain.
Thanks @yohan2on for the class, it was worth the time
Hi @elity-sitio
Thanks for participating in the Steemit Crypto Academy
Feedback
Your article lacks an in-depth technical analysis in regards to Swing trading. You were so brief in your presentation. You needed to explain the charts used in a more detailed way.
Homework task
6