UNDERSTANDING TRENDS - CRYPTOACADEMY - S5W1 HOME WORK POST FOR @REMINISCENCE01
QUESTIONS
- a) What do you understand by a Trending market?
b) What is a bullish and a bearish trend? (screenshot required)- Explain the following trend identification and give an example of each of them. (Original screenshot needed from your chart). Do this for a bullish and a bearish trend.
i) Market Structure.
ii) Trendlines- Explain trend continuation and how to spot them using market structure and trendlines. (Screenshot needed). Do this for both bullish and bearish trends.
- Pick up any crypto-asset chart and answer the following questions -
i) Is the market trending?
ii) What is the current market trend? (Use the chart to back up your answers).- Conclusion.

ANSWER TO QUESTION 1A
What do you understand by a Trending market?
A trending market is a market in which the price of a currency moves in either a bullish trend (upwards) or in a bearish trend (downwards). It can be seen as a condition whereby the price of a market moves in a particular direction.
when the trend of a market is bullish (upwards), prices normally closes in a higher high and a higher low pattern which is to say that the new high point created in every uptrend must be higher than the previous high (higher high) whereas in situation of higher low the new low must be higher than the previous low.
When a market is in trending movement, it gives technical analysts numerous trading options. It helps them in the sense that technical analysts being individuals that understands the market will know when to enter into the market to place a trade using guidelines from the trend of the market.
In trading, traders make use of patterns and trend lines for the identification of the direction of a trend and also understand a possible reverse in the trend.
One advantage of trading in accordance with the direction of a trend is that it gives a trader the opportunity to understanding every necessary change therefore knowing when to enter and leave the market.
ANSWER TO QUESTION 1B
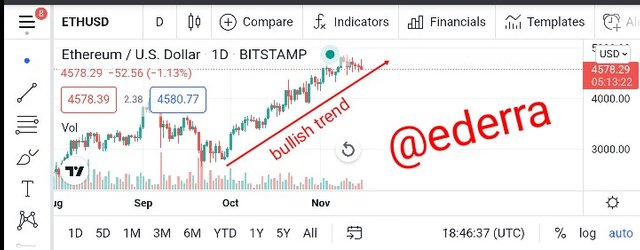
What is a bullish and a bearish trend? (screenshot required)
BULLISH TREND
A bullish trend can be seen as the upward movement in price which is indicated by the use of a higher high and higher low movement in candlesticks.
This trend normally occurs when the market is in huge demand for buyers. During a bullish trend, the prices of a particular currency tends to rise due to the fact that the market has more buyers than sellers so the volume of the currency in crypto market is very low.
When a market trend is bullish traders tend to invest at a higher rate because it's a period of profit making.
The major aim of a trader during a bullish trend is to sell currencies that was bought during a bearish trend.
Below are some characteristics of the bullish trend:
- increase in price of a currency.
- the demand for that currency is high.
- the confidence level of a trader is very high during a bullish trend etc.
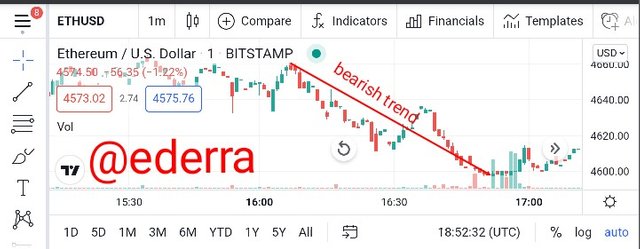
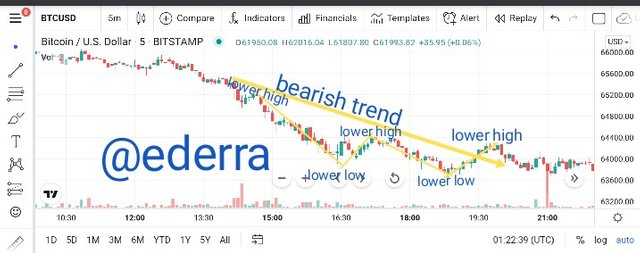
BEARISH TREND
The bearish trend is a direct opposite of the bullish trend. Instead of the upward movement of a bullish trend, here the movement is in a downward pattern.
The bearish trend is a situation where by the price of the market moves in a lower high and a lower low pattern.
During a bearish trend, the prices of a currency falls as the trend moves slowly downward. It's in a bearish trend that traders leave the market or buy currency to sell during a bullish trend. Peradventure if a trader wishes to trade during a bearish trend, the confidence level drops automatically.
As we now know, the volume of a particular currency in market can either lead to a bullish trend or bearish trend. When the volume is high in market, the bearish trend occurs which automatically leads to panic from holders and this panic makes them sell off their holdings thereby leading to more bearish trend.
Below are some characteristics of a bearish trend.
- Downward movement in price.
- change in price of a currency probably lower in price.
- low level of confidence exhibited by the traders.
ANSWER TO QUESTION 2
Explain the following trend identification and give an example of each of them. (Original screenshot needed from your chart). Do this for a bullish and a bearish trend.
i) Market Structure.
ii) Trendlines
MARKET STRUCTURE
Market structure is a tool used by technical analysts to detect price movement in the market. This structure shows an analyst wether the market is moving in an uptrend (bullish), downtrend (bearish) or in a ranging movement.
This Market structure which is also called price action is called a market structure because it shows an analyst the pattern in which a market is moving. When a trader understands the trend and notices when the trend is about to break, we can therefore say that the trader is set to go into the market.
BULLISH TREND
Bullish trend has been explained above. It was said that during a bullish trend, the upward movement in candlesticks is indicated with a higher high and higher low pattern of movement.
During this movement, a later higher high is often lower that the formal higher and a later higher low is also lower than a formal higher low.
This movement pattern can further be explained by saying that: the price of a market moves higher than the previous because of the availability of buyers in the market and a low supply of currency in that same market.
During a bullish trend, traders often go into market for trading.
Below is diagramatical representation of a bullish trend in market structure.
BEARISH TREND
In a bearish market structure, the movement of the candlesticks is in a lower high and lower low pattern.
A bearish trend denotes a fall in price of a market because of the availability of more sellers than buyers in the market.
A lower high and a lower low formation in bearish trend means that the later lower high is lower than the former lower high whereas the later lower low is also lower than the former lower low. Which is further explained as the price of the market has failed to move above the previous swing high which can result to falling of price.
Example:
TRENDLINES
When talking about trendlines, we are talking about another amazing technical analysis tools used by traders to detect the market.
It is the use of two low points and two high points to represent an uptrend and a downtrend respectively which helps the trader to know the particular direction the market is moving to.
One importance of this trend line is that it can be used regardless of time and interval.
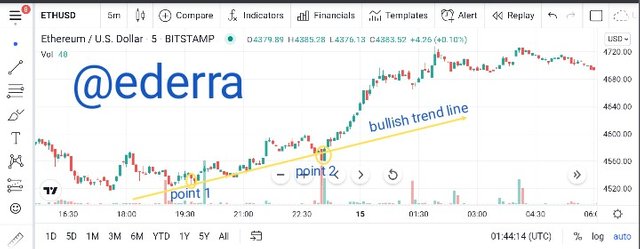
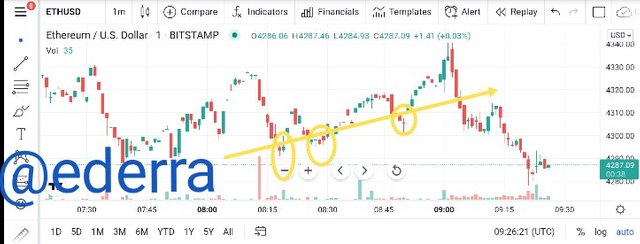
BULLISH TRENDLINE
In a bullish trend line two low points are used to represent an uptrend. Whenever price touches the trendline, it moves up immediately in a bullish pattern. That point where the price touches the trendline is called an entry point which means that traders can enter the market and flow with the trend until they notice reversal in trend.
Example:
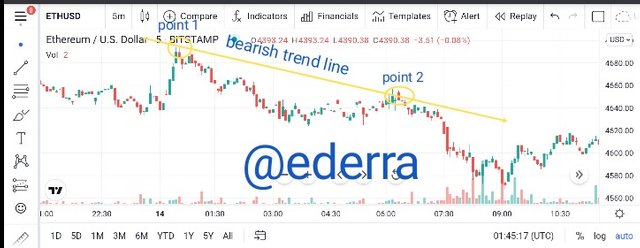
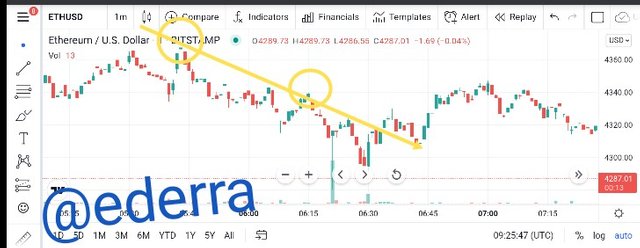
BEARISH TRENDLINE
The bearish trend line is represented by the use of two high points that denotes downtrend. Whenever the price touches the trendline, it moves lower in a downtrend manner. Like the bullish trend line, traders can also enter the market during a bearish trend at that point where the price touches the trendline and keep trading until there's a reversal in trend.
Example:
ANSWER TO QUESTION 3
Explain trend continuation and how to spot them using market structure and trendlines. (Screenshot needed). Do this for both bullish and bearish trends.
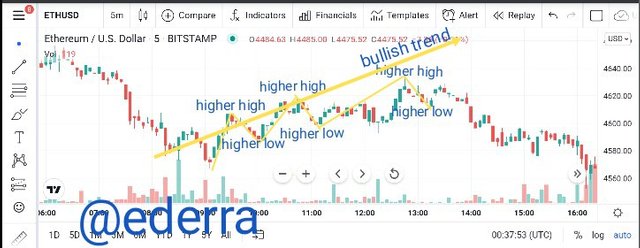
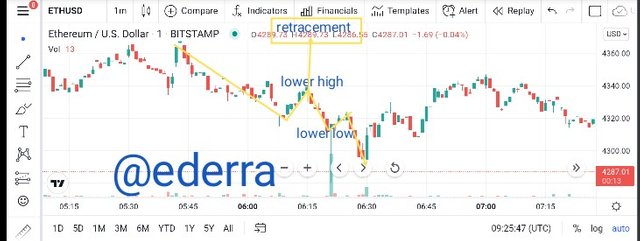
TREND CONTINUATION
When talking about trend continuation, two words comes into mind which is fluctuation and retracement. It's this fluctuation and retracement that makes the candlesticks to move in a zig-zag pattern. One major advantage of trend continuation is that a very observable trader knows when to enter the market and also notice when the trend is about to reverse.
SPOTTING TREND CONTINUATION USING MARKET STRUCTURE
It's very known to us that a market structure is an analysis tools that helps a trader detect the change in price of a market.
It's also very obvious that a market can either move in an uptrend downtrend or ranging pattern.
When a market moves in an uptrend pattern, the candlesticks form a higher high and a higher low formation.
In the case of downtrend, the market moves in a lower high and lower low formation.
Now, in a bullish trend continuation, after a higher high formation, the market fluctuates to form a higher low. After which it retraces back to another higher high in flow-like manner.
Example:
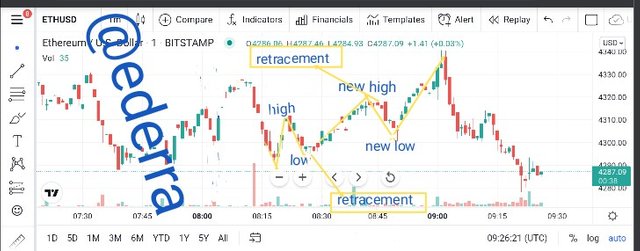
Now, the above applies also to a bearish trend continuation, but the difference is that the trend in a bearish market moves downwards. So instead of a higher high, it forms a lower high which fluctuates to form a lower low afterwards retraces back to form another lower high.
Example:
SPOTTING TREND CONTINUATION USING TRENDLINES
Another amazing technical analysis tool is the trendline.
This trendline has been discussed above so much emphasis will not be laid on it.
In a bullish and bearish trend continuation, whenever price touches a trendline, it moves in uptrend or downtrend respectively.
Examples:
ANSWER TO QUESTION 4
Pick up any crypto-asset chart and answer the following questions -
i) Is the market trending?
ii) What is the current market trend? (Use the chart to back up your answers)
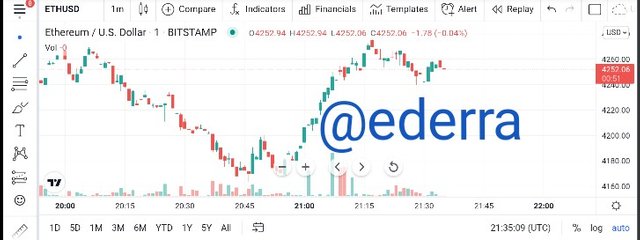
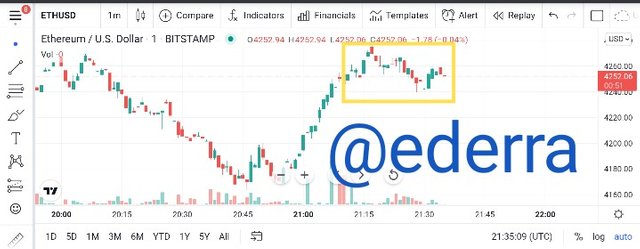
I'll use ETHUSD as the crypto asset.
IS THE MARKET TRENDING?
Looking at the above ETHUSD screenshot, I'll say the market is not trending right now.
Around 8pm today, market was moving in a downtrend pattern (bearish) but 8:45, it changed to an uptrend (bullish). Right now, the market is not trending.
WHAT IS THE CURRENT MARKET TREND
Right now, the market is not trending, it's ranging.
Here's a screenshot evidence.
CONCLUSION
First of all, I want to thank the awesome effort that was taken by prof @reminiscence01 to break down this lesson into every possible bit and also putting effort in teaching this bits to my understanding.
The lesson focuses mainly on trend. Be it bullish, bearish or ranging and their influences in a the price of a market. I've consulted the lesson and also used the internet to understand more before participating in this assignment.
So, at this point, I can say the lesson has sinked in, and I've done the assignment.
Note: All unsourced images are screenshots from trading view