Steemit Crypto Academy Season 4 Beginner's Course - Task 10: Candlestick Patterns. Home work task for @reminiscence01
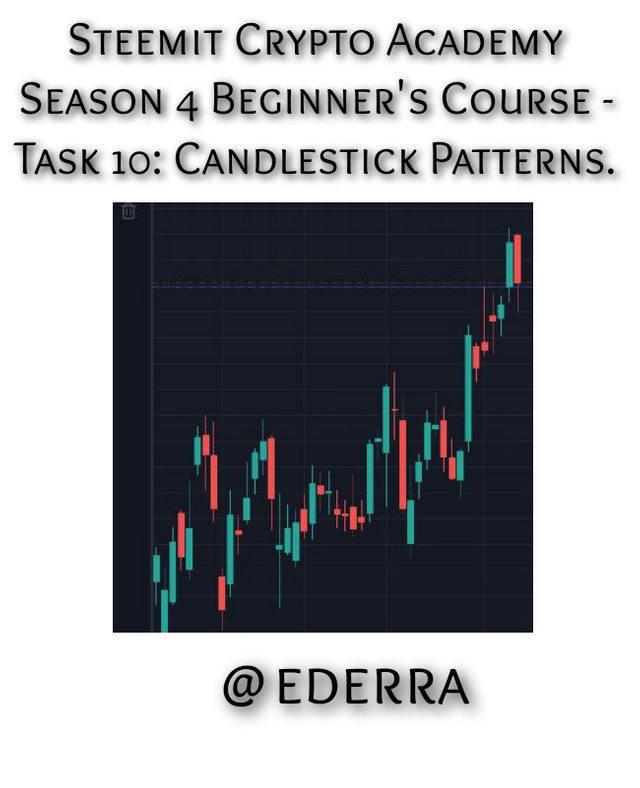
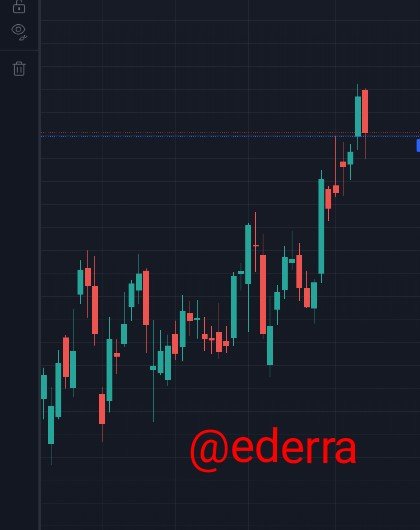
1a) Explain the Japanese candlestick chart? (Original screenshot required).
b) In your own words, explain why the Japanese Candlestick chart is the most used in the financial market.
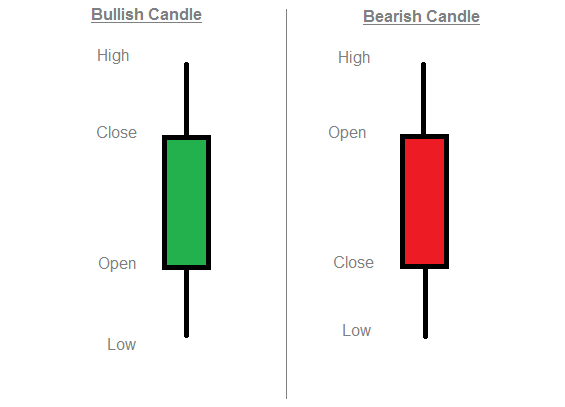
c) Describe a bullish and a bearish candle. Also, explain its anatomy. (Original screenshot required)

Japanese Candlesticks are seen as technical analysis tool used by traders to analyze price movement in the financial market.
Candlesticks chart was a birth idea of a japenese rice trader called Munehisa Homma.
He discovered that rice market is influenced by the emotions of traders in the course of recognizing the influence of demand and supply in rice in the market.
In other to stay in line with rice price, he developed candlesticks (with different colors for easy identification) that displays price movement in a graphical manner and this candlestick patterns helped him and other traders to make essential decision in regards to rice price.
In recent time, the Japanese candlestick chart is among the popular charts used for technical analysis in the financial market. It's a product of the interaction between buyers and sellers on a particular asset, and it's used to determine the person in control of price between the buyer and the seller in a financial market.

The japanese candlestick as history states is used by the rice traders to keep in touch with details in the demand and supply of rice.
Now, there's a key word we should note in that statement which is Details.
In our recent world, people want to know the details of a particular thing, before embarking on it.
So, in other for traders to have detailed and accurate information about price movement in our today world, they'll have to use the Japanese candlestick.
And that's the major reason why it's mostly used in the financial market over all other charts.

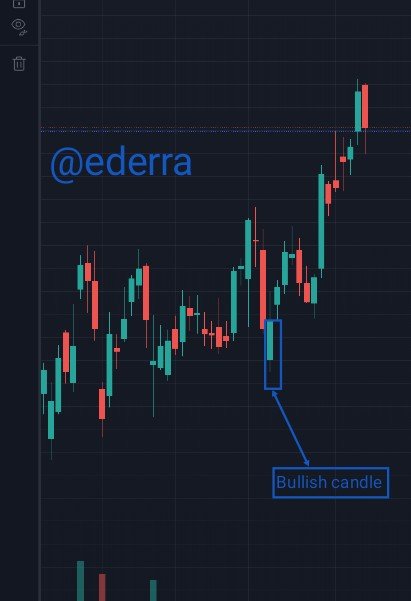
Bullish candle
As we all know, there are two major types of candlestick which are the bullish and bearish Candle. The bullish candlesticks is the one that traders use in buying stocks strategically in the financial market.
The bullish candlestick pattern moves from a downward trend to an upward trend which can be seen as a reversal in trend of stock price.
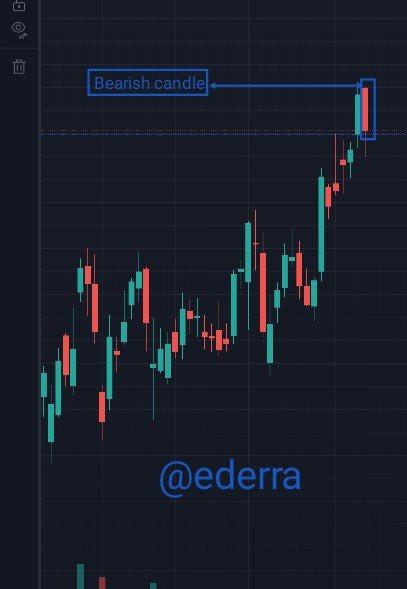
Bearish candlestick
The bearish candlestick is another half of the two types of candlestick.
It's that candle stick that's formed when a closing price is below an opening price.
When the closing price for a particular time frame is lesser than the opening price, a bearish candlestick is always formed.
Anatomy of a bullish and bearish candlestick
A bullish and bearish candlesticks is made up of the open, the high, the low and the close.
This different part play different roles.
the opening price : The opening price is the part of the candlestick that shows the start of price movement.
The Highest price : As the implies, the highest price is that part of a candlestick that shows the highest price recorded in a particular time frame.
Lowest price : This part is the opposite of the highest price.It shows the lowest price recorded in a particular time frame.
Closing price : Another amazing part of a candlestick is the closing price. The last price recorded is shown in the closing price.
The japanese candlestick inventory is among the successful inventories that's helping traders to keep hold of the necessary details and information needed to know the movement in price in the financial market.
Well, I actually wish to use this medium to thank the professor @reminiscence01 for teaching this lecture to my very best understanding.
The screenshots and sourced images he used were very informative.
Note: All unsourced images are screenshots made by me.
You remarks Have to be hold. We will get back to you soon.
Thank you very much @dilchamo
I've noted my errors, I promise to do better next time.
Good day prof @dilchamo
Actually, am seeing your comment today
And am getting worried.
Please get back to me soon