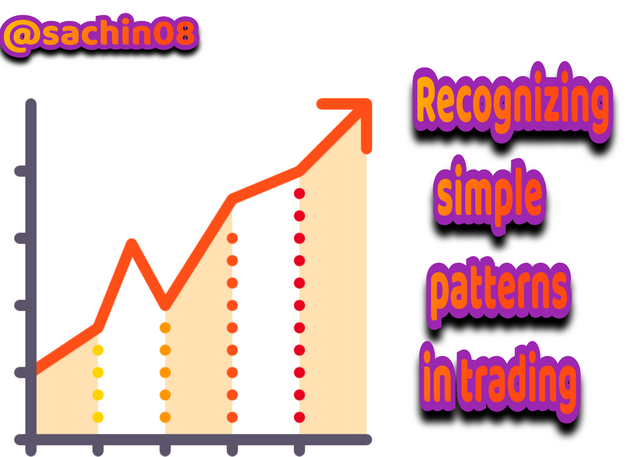
Recognizing simple patterns in trading / Crypto Academy / S5W1- Homework Post for @sachin08
QUESTIONS
- What is your understanding about Triangles in Trading. Explain all forms of triangles in your own words. (Screenshot required)
- Can we also use some Indicators along with it Triangle Patterns? Explain with Screenshots.
- Explain Flags in Trading in your own words and provide screenshots of both Bull Flag and Bear Flag.
- Show a full trade setup using these Patterns on any Cryptocurrency chart. (Ascending Triangle, Symmetrical Triangle, Bear Flag)
- Conclusion

ANSWER TO QUESTION 1
What is your understanding about Triangles in Trading. Explain all forms of triangles in your own words. (Screenshot required)
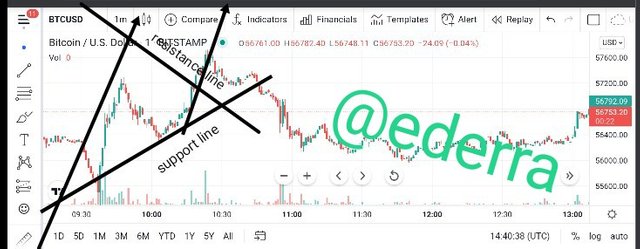
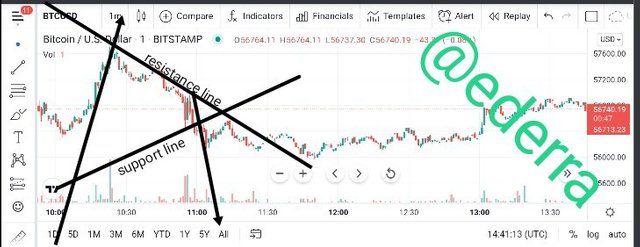
As we all know, a triangle is a very popular shape with three sides. This mathematical pattern of triangle is also used in trading. When a trendline is drawn along a converging price range, that trendline forms the shape of a triangle. This trendline drawn across converging price range is seen as a triangle because the resistance trendline and the support trendline meets on the right hand side of a chart to form what is called a corner. There are three forms of triangle namely;
- symmetric triangle (neutral)
- Ascending triangle ( bullish)
- descending triangle (bearish)
SYMMETRIC TRIANGLE (NEUTRAL)
The symmetric triangle is made up of two diagonal lines, the falling upper trendline and the rising lower trendline. In a symmetric triangle, when the price rises, the candlesticks move in an uptrend manner therefore causing an uptrend break out and making room for very observant traders to enter the market and make profit. A reverse principle applies when price drops. The candlesticks moves in a downtrend manner causing a breakdown in price. And at this point, traders apply stop loss technique.
ASCENDING TRIANGLE (BULLISH)
An ascending triangle is a triangle in which the candlesticks move in an uptrend pattern. This triangle is sometimes called a bullish triangle because it moves in uptrend which is higher high and higher low. This triangle is very easy to recognize and it's break out point is always accompanied by an entry point for traders. In an ascending triangle, whenever the price reaches a higher high, it bounces off to create and higher low higher than the previous higher low which rises again and performs the same operation until it reaches a breakout point.
DESCENDING TRIANGLE (BEARISH)
The descending triangle is a complete opposite of the ascending triangle. It's candlesticks move in a downtrend manner which is a reason why it's also considered a bearish triangle. The descending triangle moves in lower high and lower low pattern. During this movement, when price reaches a lower high, it bounces off to form a new lower low that's lower than the previous lower low which gives it a slant look.
In the descending triangle, a breakdown causes an obstruction which makes the market to go all bearish.
ANSWER TO QUESTION 2
Can we also use some Indicators along with it Triangle Patterns? Explain with Screenshots.
The answer to this question is YES. some indicators can be used alongside with triangle patterns.
Indicators are tools used in recognizing the change in price of currencies in a Crypto market. There are basically four types of indicators which are the trend indicator, the momentum indicator, the volatility indicator and the volume indicator.
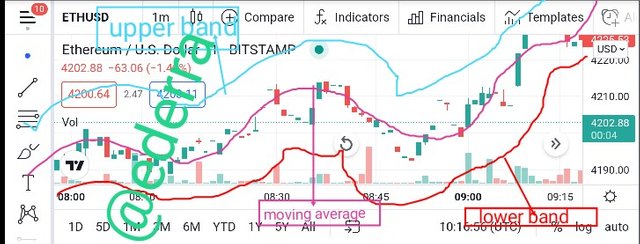
The above types of indicators can be used alongside with a triangle pattern to place a trade. In the course of this assignment, I'll be explaining the bollinger band of the volatility indicator.
The bollinger band is an indicator that's used in measuring the highness and lowness of price in a Crypto market. This bollinger band is used by traders to plot trend lines which helps them know when a coin has been overbought or oversold thereby knowing when to enter or leave the market.
ANSWER TO QUESTION 3
Explain Flags in Trading in your own words and provide screenshots of both Bull Flag and Bear Flag.
A flag is another dimension of a triangle pattern in crypto. It's a continuation chart that can either be bullish or bearish in nature. This triangle is called a flag because the shape it forms looks like a flag. The flag is also used by crypto gurus to predict the market and know when to enter a market. There are two types of flags.
- BULLISH FLAG
- BEARISH FLAG
BULLISH FLAG
It's now conversant with us that anything bullish moves in an uptrend direction. So, a bullish flag simple put can be seen as that flag that moves in an uptrend direction forming an higher high and higher low candlesticks pattern.
According to professor @sachin08, a bullish flag can be recognized when there's a flag sign, and that flag sign was accompanied by an uptrend movement in candlesticks and this formed flag points to downside direction. During this movement, a very smart crypto expert watches the resistance and support line to know when the resistance line breaks the support line to start trading.
BEARISH FLAG
The bearish flag is a direct opposite of the bullish flag. In bearish flag, the candlesticks movement is in a downtrend pattern. In recognizing a bearish flag, there must be a flag, then a bearish movement in price, and then a flag pattern that's pointing upward direction. During this movement, what traders look forward to is the point where the resistance line breaks the support line which can be called the entry point. It's at the entry point that traders starts placing trade.
ANSWER TO QUESTION 4
show a full trade set up using these patterns on any crypto currency charts (ascending triangle, symmetric triangle, bear flag)
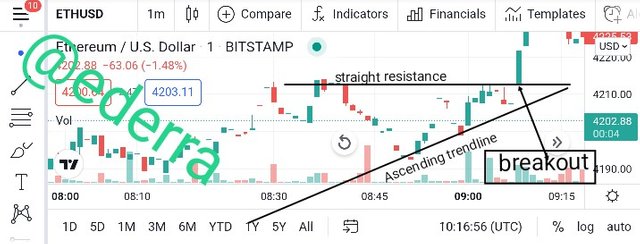
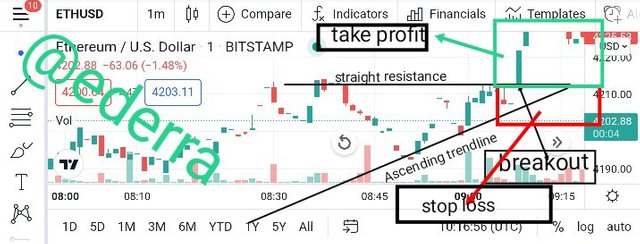
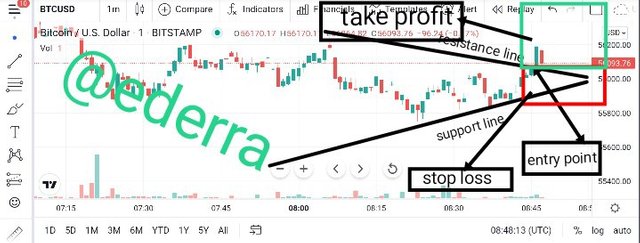
TRADE SET UP USING AN ASCENDING TRIANGLE
In an ascending triangle, the candlesticks moves in a higher high and higher low movement and whenever the price touches the previous higher high, it bounces off to form a higher low that's higher than the previous higher low thereby maintaining the ascending shape.
During this movement, traders watch the resistance line and the support line. When ever the resistance line breaks the support line, the place trade and consider that place the entry point, setting their take profit above the entry point and stop loss below it.
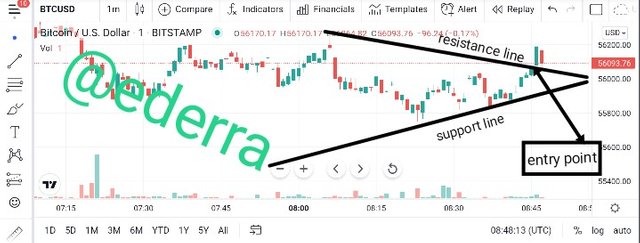
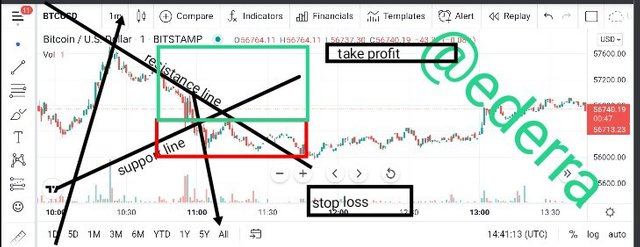
TRADE SET UP USING SYMMETRIC TRIANGLE
The symmetric triangle which is also called the neutral triangle is very unique. In this triangle, the candlesticks does not maintain a particular ascending or descending movement. Trade is placed here when resistance line breaks the support line. After this breakout, the candlesticks can either go bullish or bearish so, the trader sets his take profit and stop loss above and below the breakout point
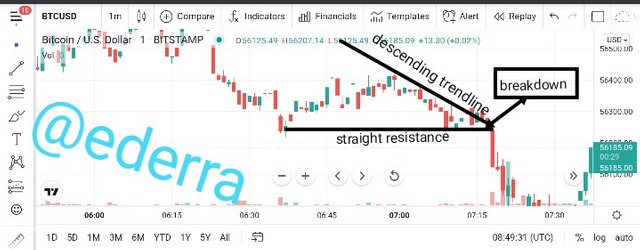
TRADE SET UP USING BEAR FLAG
In setting trade for a bear flag, what a trader does is to watch the downtrend taking note of when the resistance line will break the support line. Immediately it breaks, a stop loss and take profit mark is set.
CONCLUSION
This week's course is strictly on recognizing simple patterns in trading, paying attention to triangles and flags.
It was really an honor to have learned something new and outstanding from professor @sachin08 lesson. It was a very nice lesson which was accompanied by a very brain challenging assignment especially for newbie in crypto like me.
I must say the lesson was well thought and understood, and this is my homework post.
Note: all unsourced images are screenshots from trading view
Hello @ederra. Thank you for participating in Crypto Academy Season 5 Week 2 Beginner Course.
Feedback and Suggestions -
I appreciate your efforts and will look forward to see your next assignments.